- Analytics
- Top Gainers / Losers
Top Gainers and Losers: euro and US dollar
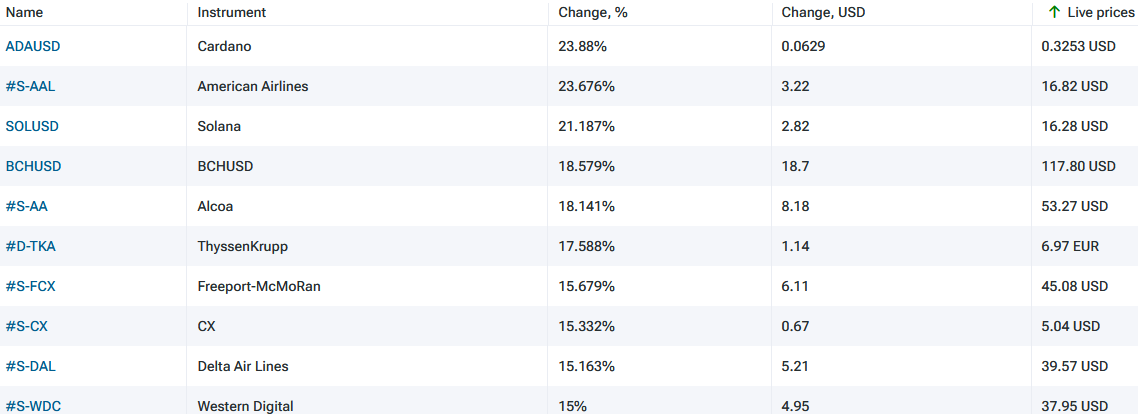
Top Gainers - global market
Over the past 7 days, the US dollar index fell and hit a 7-month low. The change in the United States Consumer Price Index (CPI) m/m in December turned out to be negative (-0.1%) for the first time since May 2020. Investors believe that the beginning of the decline in inflation may limit further tightening of the Fed's monetary policy. Accordingly, the US dollar was among the leaders of the weakening last week. The euro, on the contrary, strengthened due to the statement of the European Central Bank about plans to raise its rate by 1.25% during 2023. Now it is 2.5%. Recall that inflation in the EU for December in the 2nd assessment will be published on January 18. Preliminarily, it amounted to 9.2% y/y. The strengthening of the yen was supported by investors' expectations that the Bank of Japan would somehow tighten its monetary policy at the January 18 meeting. The strengthening of the Chinese yuan was supported by a good foreign trade performance in December (China Trade Balance) and relatively low inflation (+1.8% y/y). US natural gas quotes continued to decline for the 4th week in a row due to warmer weather, as well as due to reduced industrial production and demand for gas in Europe.
1. ADAUSD, +23.9% – Cryptocurrency Cardano (ADA)
2. American Airlines Group Inc., +23.7% – American airline
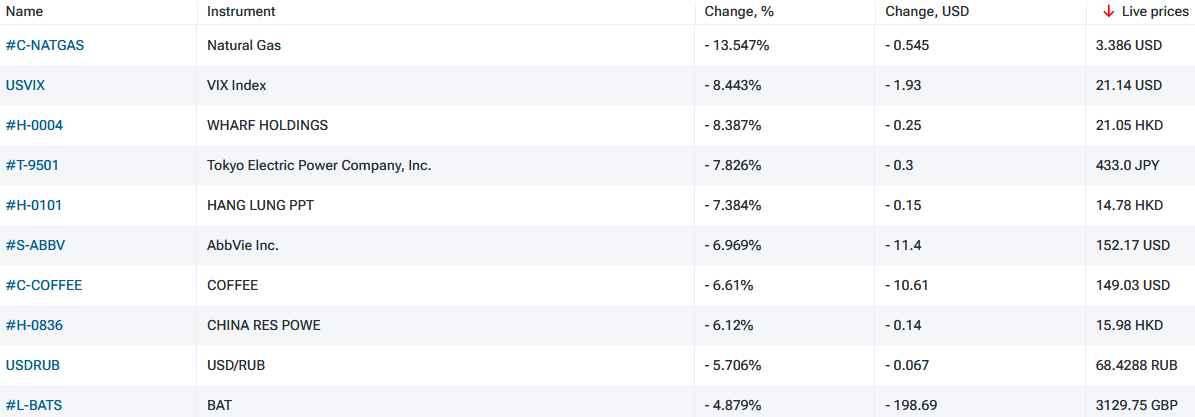
Top Losers - global market
1. VIX Index – CFD on CBOE Volatility Index (Chicago Board Options Exchange)
2. Henry Hub Natural Gas Futures – CFDs on American gas futures.
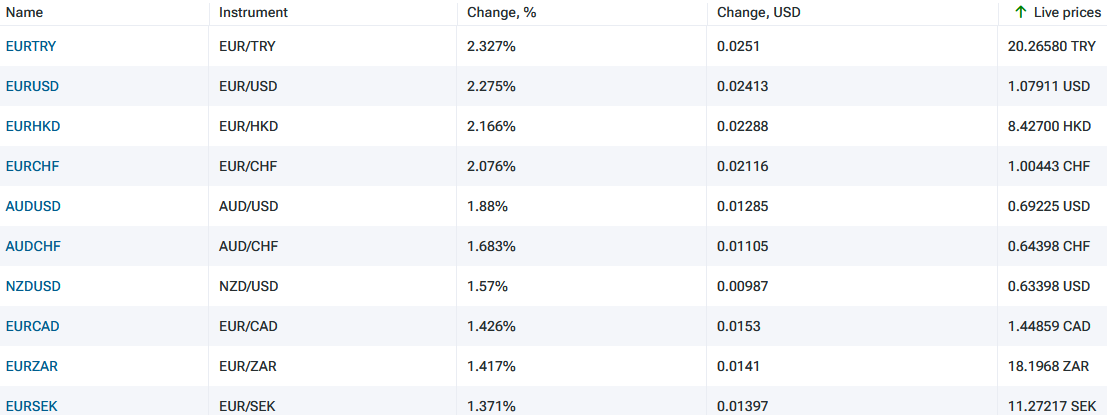
Top Gainers - foreign exchange market (Forex)
1. EURTRY, EURUSD - the growth of these graphs means the strengthening of the euro against the Turkish lira and the US dollar.
2. EURHKD, EURCHF - the growth of these graphs means the weakening of the Hong Kong dollar and the Swiss franc against the euro.
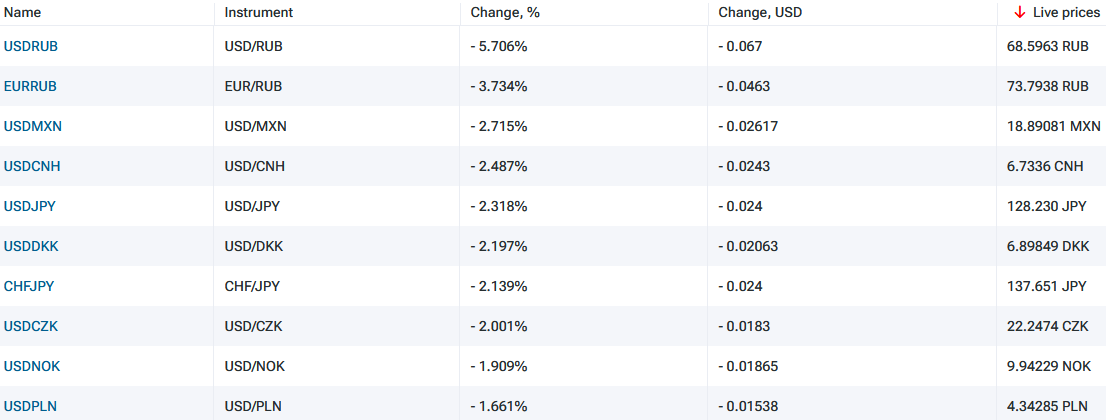
Top Losers - foreign exchange market (Forex)
1. USDCNH, USDMXN - the fall of these graphs means the weakening of the US dollar against the Chinese yuan and the Mexican peso.
2. USDJPY, USDDDK - the fall of these graphs means the strengthening of the Japanese yen and the Danish krone against the US dollar.
New Exclusive Analytical Tool
Any date range - from 1 day to 1 year
Any Trading Group - Forex, Stocks, Indices, etc.
Note:
This overview has an informative and tutorial character and is published for free. All the data, included in the overview, are received from public sources, recognized as more or less reliable. Moreover, there is no guarantee that the indicated information is full and precise. Overviews are not updated. The whole information in each overview, including opinion, indicators, charts and anything else, is provided only for familiarization purposes and is not financial advice or а recommendation. The whole text and its any part, as well as the charts cannot be considered as an offer to make a deal with any asset. IFC Markets and its employees under any circumstances are not liable for any action taken by someone else during or after reading the overview.
- Get Certificate


Previous Top Gainers & Losers
Over the past 7 days, the American dollar has remained almost unchanged. According to the CME FedWatch tool, there is an 89% probability of the U.S. Federal Reserve raising interest rates at the meeting on July 26th. The Swiss franc has strengthened due to positive economic indicators such as Credit...
Over the past 7 days, the US dollar index has declined. As expected, the Federal Reserve (Fed) maintained its interest rate at 5.25% during the meeting on June 14. Now, investors are monitoring economic statistics and trying to forecast the change in the Fed's rate at the next meeting on July 26. The...
Over the past 7 days, the US dollar index has remained largely unchanged. It has been trading in a narrow range of 103.2-104.4 points for the 4th week in a row. Investors are awaiting the outcome of the Federal Reserve meeting on June 14. Tesla shares have risen due to the opening of new gigafactories...