- Analytics
- Top Gainers / Losers
Top Gainers and Losers: Japanese Yen and South African Rand
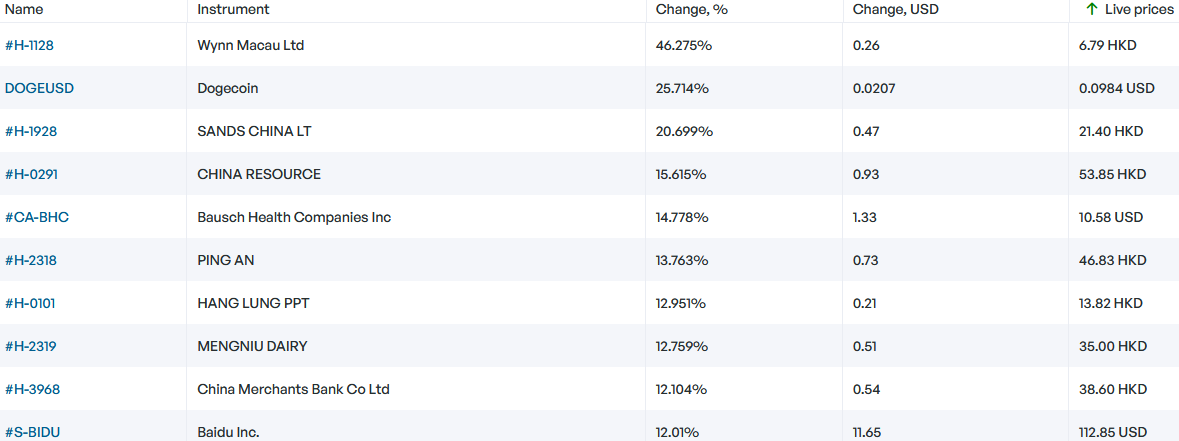
Top Gainers - global market
Over the past 7 days, the US dollar index continued to decline and updated a 5-month low. Based on US statistics, market participants expect a slowdown in the Fed rate growth. According to CME FedWatch, at the next Fed meeting on December 14, it will be increased by only 0.5% to 4.5% with a probability of about 80%. Earlier, the US regulator raised the rate by 0.75% 4 times in a row. The 10-Year US Treasury yield hit a new 9-week low of 3.5% on Friday. The weakening of the South African rand came amid risks of impeachment of South African President Cyril Ramaphosa. The Canadian dollar fell against the backdrop of falling oil and gas prices. In addition, investors expect the Bank of Canada rate to increase by only 0.25% to 4% at the meeting on December 7 from the current level of 3.75%. The Japanese yen continued to strengthen from its 30-year low, which looks like a USDJPY high. Earlier, the Bank of Japan (-0.1%) said it would not allow the yen to weaken too much. Recall that the meeting will be held on December 20.
1. DOGEUSD, +25.7% – Dogecoin cryptocurrency (DOGE)
2. Wynn Macau, Limited, +46.3% – casino and hotel management company in Macau
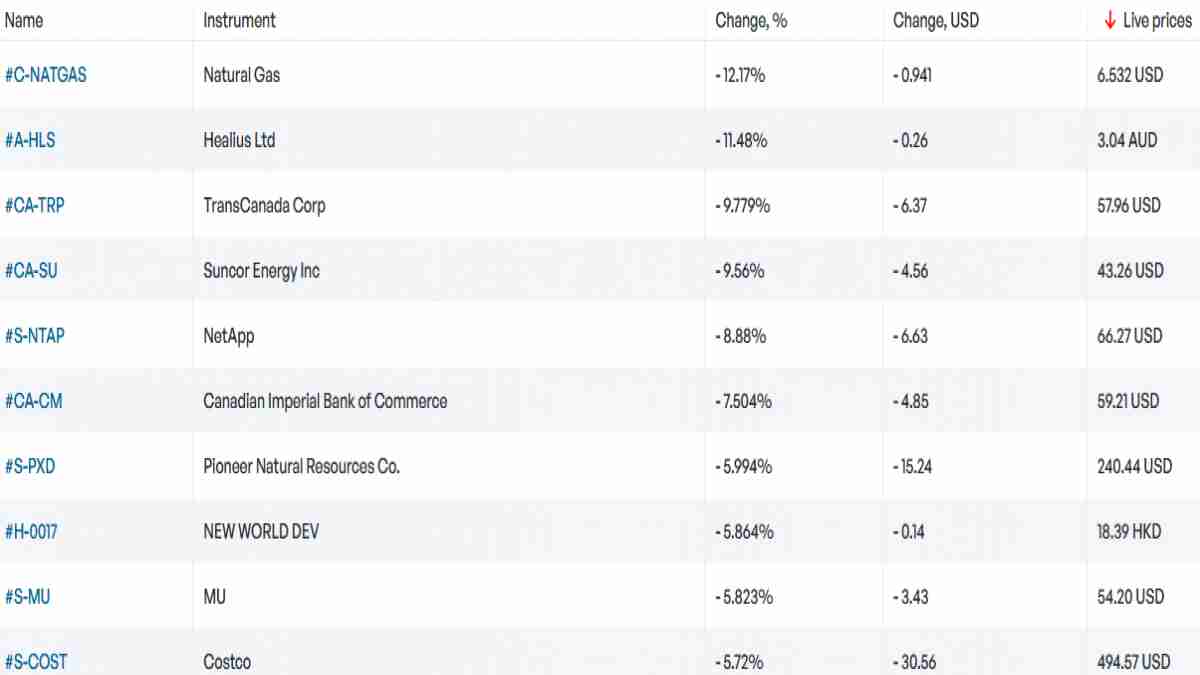
Top Losers - global market
1. Henry Hub Natural Gas Futures CFD – US natural gas
2. Healius Ltd. – Australian health insurance company.
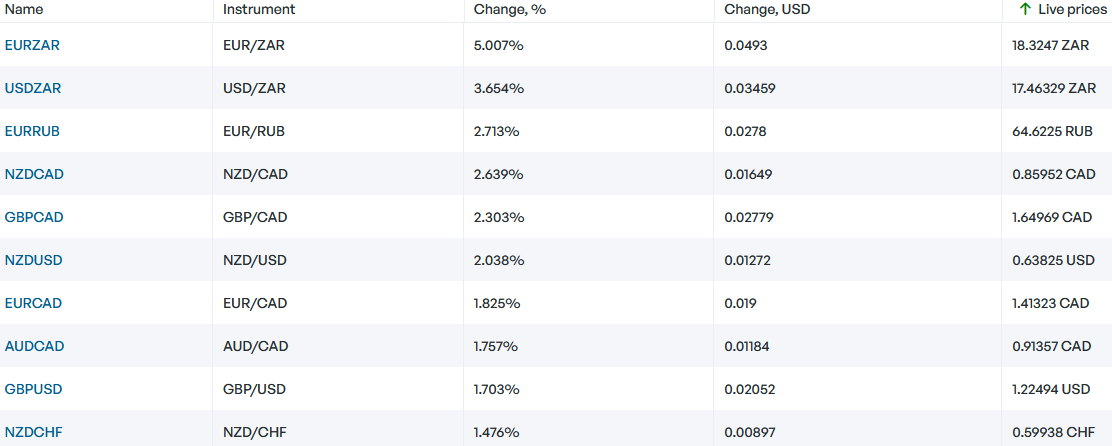
Top Gainers - foreign exchange market (Forex)
1. EURZAR, USDZAR - the growth of these graphs means the strengthening of the euro and the US dollar against the South African rand.
2. NZDCAD, GBPCAD - the growth of these graphs means the weakening of the Canadian dollar against the New Zealand dollar and the British pound.
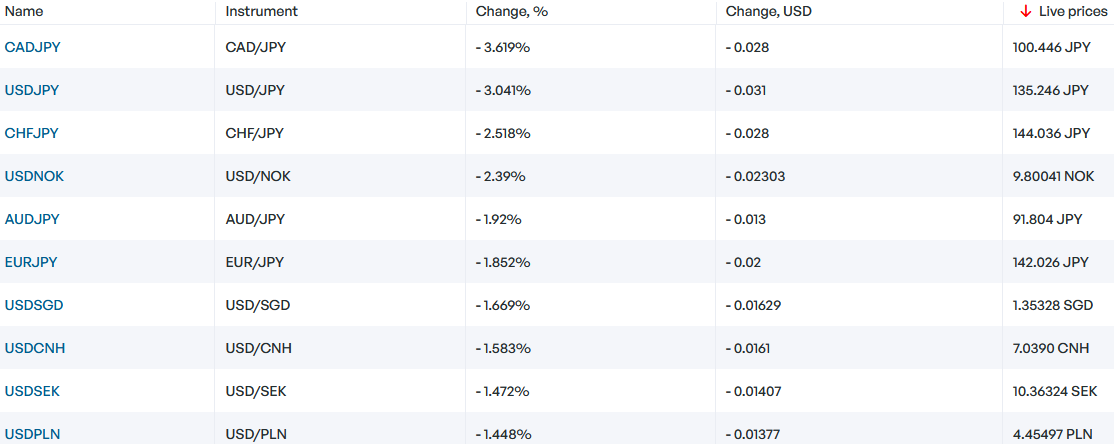
Top Losers - foreign exchange market (Forex)
1. CADJPY, CHFJPY - the decline of these graphs means the weakening of the Canadian dollar and the Swiss franc against the Japanese yen.
2. USDJPY, USDNOK - the decline in these graphs means the strengthening of the Japanese yen and the Norwegian krone against the US dollar.
New Exclusive Analytical Tool
Any date range - from 1 day to 1 year
Any Trading Group - Forex, Stocks, Indices, etc.
Note:
This overview has an informative and tutorial character and is published for free. All the data, included in the overview, are received from public sources, recognized as more or less reliable. Moreover, there is no guarantee that the indicated information is full and precise. Overviews are not updated. The whole information in each overview, including opinion, indicators, charts and anything else, is provided only for familiarization purposes and is not financial advice or а recommendation. The whole text and its any part, as well as the charts cannot be considered as an offer to make a deal with any asset. IFC Markets and its employees under any circumstances are not liable for any action taken by someone else during or after reading the overview.
- Get Certificate


Previous Top Gainers & Losers
Over the past 7 days, the American dollar has remained almost unchanged. According to the CME FedWatch tool, there is an 89% probability of the U.S. Federal Reserve raising interest rates at the meeting on July 26th. The Swiss franc has strengthened due to positive economic indicators such as Credit...
Over the past 7 days, the US dollar index has declined. As expected, the Federal Reserve (Fed) maintained its interest rate at 5.25% during the meeting on June 14. Now, investors are monitoring economic statistics and trying to forecast the change in the Fed's rate at the next meeting on July 26. The...
Over the past 7 days, the US dollar index has remained largely unchanged. It has been trading in a narrow range of 103.2-104.4 points for the 4th week in a row. Investors are awaiting the outcome of the Federal Reserve meeting on June 14. Tesla shares have risen due to the opening of new gigafactories...