- Analytics
- Market Data
- Precious Metals Prices
- XAUUSD Price Chart
XAUUSD Live Chart - Gold USD Prices
The Gold price today is $5084.240. This page includes full information about the Gold, including the XAUUSD live chart and dynamics on the chart by choosing any of 8 available time frames.
XAUUSD Price Live
Gold today is an important piece of information for traders for several reasons.
The XAUUSD price is a key indicator of a precious metals's supply and demand. By knowing the current price, traders can assess potential future price movements and make informed decisions about buying, selling, or holding their positions.
Tracking the Gold price over time allows traders to identify trends in the market. Is the price rising or falling? Understanding these trends can help traders predict future price movements and capitalize on profitable opportunities.
Precious metals market is volatile, and prices can fluctuate significantly. Knowing the current price helps traders manage their risk by setting stop-loss orders and other risk management strategies.
XAUUSD Price and Rate Today
Staying on top of the XAUUSD price is crucial for traders in today's market. The Gold price serves as a benchmark for many precious metals contracts, and knowing its current value allows traders to make informed decisions in two key ways:
- Measuring Market Value: by knowing the current XAUUSD price, traders can assess the overall health of the market. A rising Gold price might indicate strong demand, while a falling price could suggest a surplus in supply. This understanding of market value helps traders make informed decisions about buying, selling, or holding their positions.
- Benchmarking Performance: many precious metal contracts are priced relative to the XAUUSD price. Having this information readily available allows traders to benchmark the performance of their investments and compare them to the overall market. This comparison helps traders identify opportunities and adjust their strategies accordingly.
How to Trade Gold
Gold, a major benchmark in the precious metals market, offers various avenues for traders. Here are the steps of how you can enter the Gold trading arena:
1. Choose Your Platform
- Brokers: Partner with a reputable broker who provides access to exchanges where Gold futures contracts or CFDs are traded.
- Trading Platforms: Research and select a user-friendly trading platform offered by your chosen broker. These platforms allow you to place trades, monitor prices, and analyze market trends.
2. Understand the Instruments
- Futures Contracts: These lock you into an agreement to buy or sell a specific amount of precious metal at a predetermined price by a set expiry date.
- CFDs: Contracts for Difference allow you to speculate on XAUUSD price movements without physically owning it.
3. Develop a Gold Trading Strategy
- Fundamental Analysis: Evaluate factors like global economic conditions, geopolitical events, and supply-demand dynamics that impact precious metal prices.
- Technical Analysis: Use technical indicators and chart patterns to identify potential entry and exit points for your trades.
4. Risk Management
- Start Small: Begin with smaller trade sizes to manage potential losses, especially if you're a new trader.
- Stop-Loss Orders: Implement stop-loss orders to automatically exit a trade if the price moves against you, limiting potential losses.
- Take-Profit Orders: Set take-profit orders to lock in gains when the price reaches your target level.
5. Stay Informed and Monitor Market News
Keep yourself updated on relevant Gold market news and events that can influence prices. Also consider insights from financial analysts and market experts to refine your trading decisions.
XAUUSD Price Chart
- 1m
- 5m
- 15m
- 30m
- 1h
- 4h
- 1d
- 1w
Technical Analysis
Technical analysis is a method of studying and evaluating market dynamics based on the price history. Its main purpose is to forecast price dynamics of a financial instrument in future through technical analysis tools. Technical analysts use this method of market analysis to forecast the prices of different currencies and currency pairs. This type of the analysis will allow you to make market forecast based on studying historical prices of the trading instruments.
See also latest technical analysis of the price dynamics of Gold Dollar: XAUUSD forecast.
XAUUSD News

Gold and Oil Analysis in 2025
In 2025 gold, and aluminum have outperformed other commodities. Oil is still volatile, and gas is limited by supply issues....

Will Gold Stay Above $3,300? Key Levels to Watch
Gold prices rebounded in Asian trade on Wednesday after falling sharply earlier in the week. The brief selloff followed news...

Should You Buy Gold Now? Analysis of Price Trend, War Impact, Fed Policy
Gold is hovering near $3,420 per ounce, just below its all-time high set in April. Multiple fundamental forces are driving...

Gold Hits Record Highs: Why is Gold Price Rising?
Gold prices have reached record highs, climbing to $3,380 an ounce. That’s a 25% gain just this year — and a huge 40%...

Gold Price News Analysis: Will gold price go down?
Gold hit a record high of $3,016.92 per ounce, surpassing the key $3,000 level for the second time in a week. Many headlines...

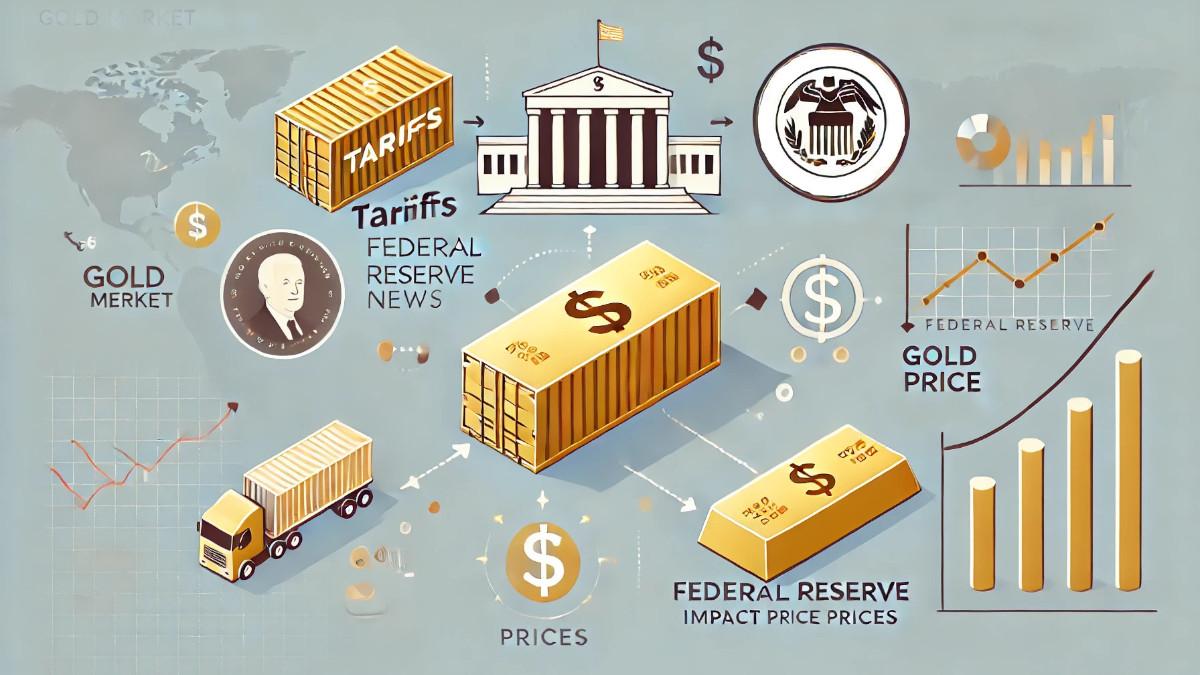
Gold Market News: How Tariffs and Fed Decisions Impact Prices
Gold prices held firm near record levels on Wednesday as investors weighed escalating trade tensions sparked by U.S. President...
