- Analytics
- Technical Analysis
Cotton Technical Analysis - Cotton Trading: 2019-12-20
Lower cotton supply estimate bullish for Cotton price
US cotton production and ending stocks were in WASDE December report. Will the Cotton price rise continue?
December’s outlook for US cotton in 2019/20 included lower production and ending stocks compared with last month, according to US Department of Agriculture’s final World Agricultural Supply and Demand Estimates report. Production was lowered by 611,000 bales mainly due to a 500,000-bale decline in Texas. Ending stocks are estimated 600,000 bales lower this month, at 5.5 million. And the global 2019/20 cotton forecasts include lower beginning stocks and production, largely offset by lower consumption. Lower US production and ending stocks are bullish for cotton price. And further increase in price when large money managed funds are short cotton by 3,000 contracts will create additional support from forced closing of short positions.
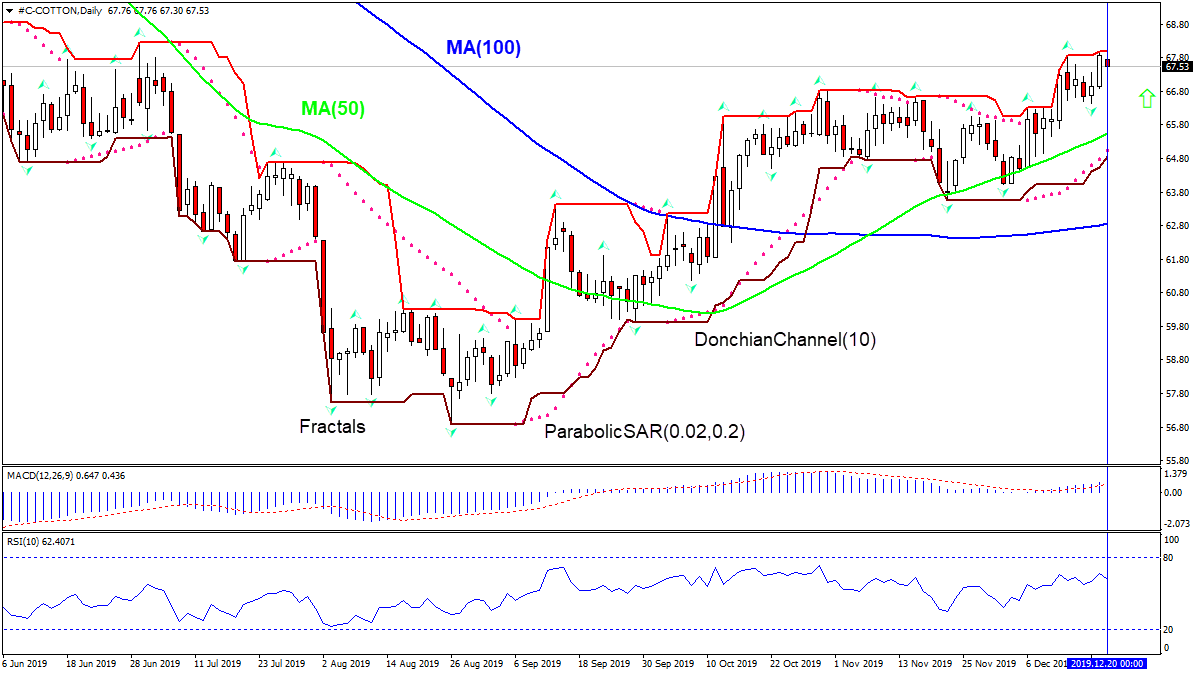
On the Daily timeframe Cotton: D1 is rising. Price is trading above the 50 and 100 day moving averages MA(50) and MA(100).
- The Parabolic Indicator gives a buy signal.
- The Donchian channel indicates uptrend: it is narrowing up.
- The RSI indicator is flat above 50.
- The MACD indicator gives bullish signal: it is above the signal line and the gap is widening.
We believe the bullish momentum will continue after the price breaches above the upper boundary of Donchian channel at 68. A level above this can be used as an entry point for placing a pending order to buy. The stop loss can be placed below the lower Donchian boundary at 64.87. After placing the order, the stop loss is to be moved every day to the next fractal low, following Parabolic signals. Thus, we are changing the expected profit/loss ratio to the breakeven point. If the price meets the stop loss level (64.87) without reaching the order (above 68), we recommend cancelling the order: the market has undergone internal changes which were not taken into account.
Technical Analysis Summary
| Order | Buy |
| Buy stop | Above 68 |
| Stop loss | Below 64.87 |
Explore our
Trading Conditions
- Spreads from 0.0 pip
- 30,000+ Trading Instruments
- Stop Out Level - Only 10%
Ready to Trade?
Open Account Note:
This overview has an informative and tutorial character and is published for free. All the data, included in the overview, are received from public sources, recognized as more or less reliable. Moreover, there is no guarantee that the indicated information is full and precise. Overviews are not updated. The whole information in each overview, including opinion, indicators, charts and anything else, is provided only for familiarization purposes and is not financial advice or а recommendation. The whole text and its any part, as well as the charts cannot be considered as an offer to make a deal with any asset. IFC Markets and its employees under any circumstances are not liable for any action taken by someone else during or after reading the overview.
