- Analytics
- Technical Analysis
FR 40 Technical Analysis - FR 40 Trading: 2017-03-15
Results of elections in Holland may affect French stocks
The parliamentary elections will take place in Holland on March 15, 2017. The victory of ultra-right Party for Freedom which favors exit from EU may signify the preponderance of the same rightist forces at the French elections. Will there be severe movements in French САС 40 index after the elections in Holland?
Many investors consider the Dutch parliamentary elections as a touchstone for the possibility that right-wing forces may win throughout the whole Europe. This significantly scales up the risk of the EU breakdown. The leader of the Dutch Party for Freedom Geert Wilders also supports the exit from EU as well the head of the French National Front Party Marine Le Pen. The 1st round of the French presidential elections will take place on April 23, 2017 while the 2nd on May 7. 2017. In its turn, the failure of the rightists in Holland may lower the political risks. Currently the yields of the 10-year indicative German Eurobonds have reached their high in recent 14 months while the CAC 40 index climbed to its 19-month high. Theoretically, both correction and continuation of the trend movement are possible. At the same time, the negative tendencies persist in French economy. The manufacturing production slumped 0.3% in January, compared to December. The same indicator for the whole Eurozone advanced 0.6%. The French trade balance deficit reached 7.94bn euros this January, its lowest level since the historical records began in 1970.
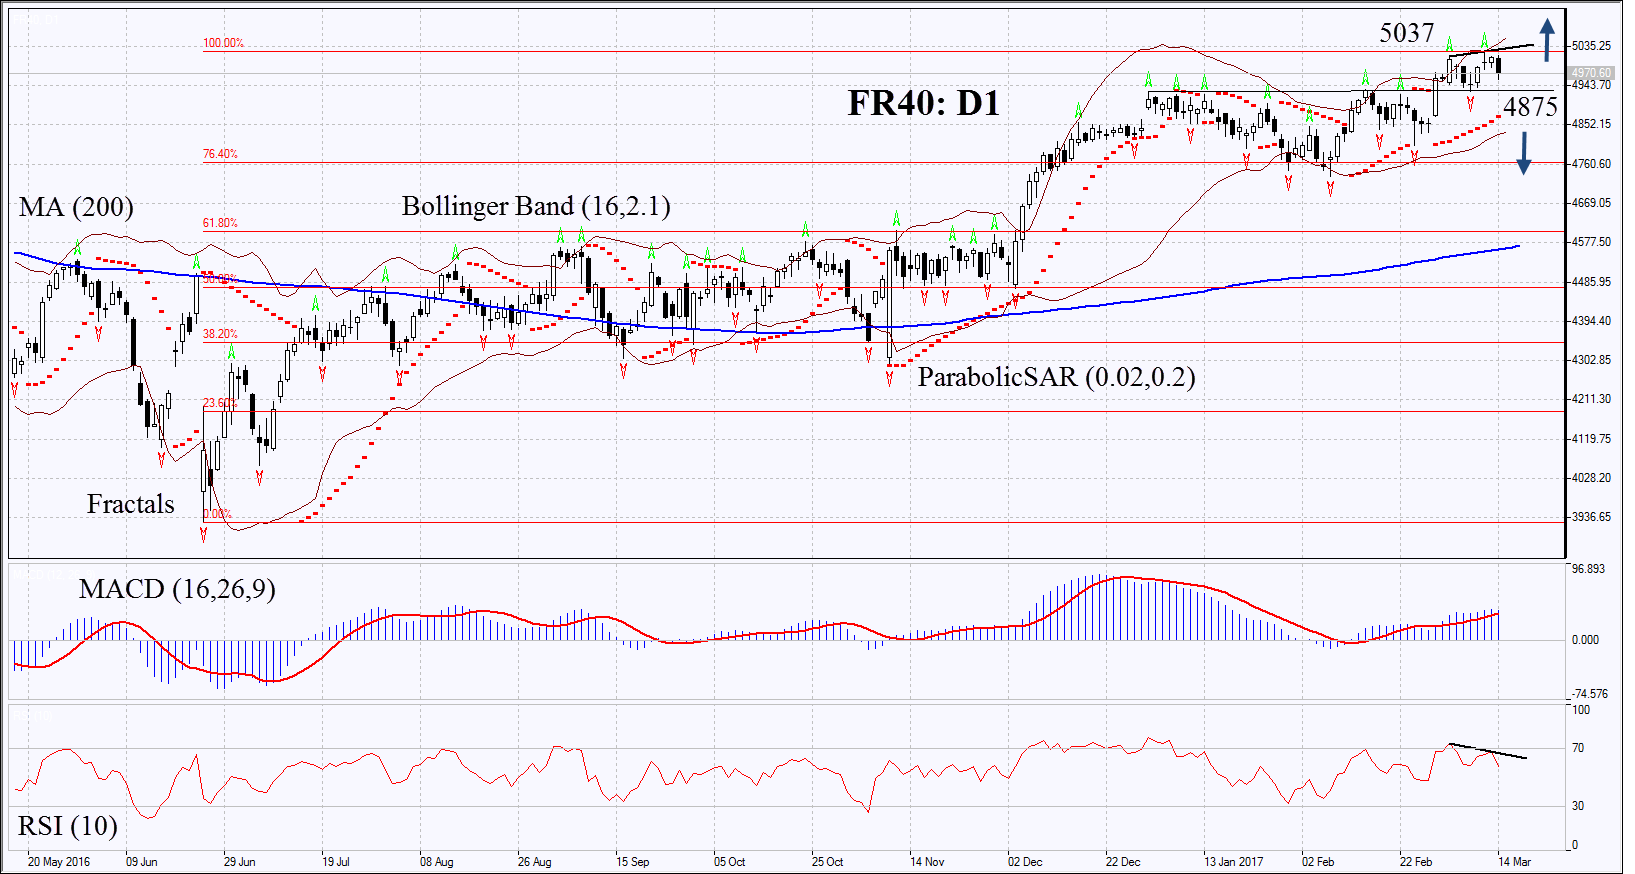
On the daily chart FR40:D1 is within the rising trend. The further price increase is possible in case the right-wing Party for Freedom loses in the Dutch parliamentary elections and in case of positive economic data in France.
- The Parabolic indicator gives bullish signal. It may serve the additional level of support which has to be broken through to open short position.
- The Bollinger bands have widened which means higher volatility.
- The RSI is above 50. It has formed negative divergence.
- The MACD gives bullish signal.
In our opinion the momentum in FR40 may form after the chart rises and surpasses the latest fractal high, the Bollinger band and the 19-month high at 5037 or in case of falling below the last fractal low and the Parabolic signal at 4875. Let the market choose the direction himself. Two or more positions may be places symmetrically: having opened one of the orders the second may be deleted as the market has chosen its direction. Having opened the pending order we shall move the stop to the next fractal high (short position) of the next fractal low (long position) following the Parabolic and Bollinger signals every four hours. The most risk-averse traders may switch to the 4-hour chart after the trade and place there a stop-loss moving it in the direction of the trade. Thus, we are changing the probable profit/loss ratio to the breakeven point. If the price meets the stop-loss level without reaching the order, we recommend cancelling the position: the market sustains internal changes which were not taken into account.
| Position | Sell |
| Sell stop | below 4875 |
| Stop loss | above 5037 |
| Position | Buy |
| Buy stop | above 5037 |
| Stop loss | below 4875 |
Explore our
Trading Conditions
- Spreads from 0.0 pip
- 30,000+ Trading Instruments
- Stop Out Level - Only 10%
Ready to Trade?
Open Account Note:
This overview has an informative and tutorial character and is published for free. All the data, included in the overview, are received from public sources, recognized as more or less reliable. Moreover, there is no guarantee that the indicated information is full and precise. Overviews are not updated. The whole information in each overview, including opinion, indicators, charts and anything else, is provided only for familiarization purposes and is not financial advice or а recommendation. The whole text and its any part, as well as the charts cannot be considered as an offer to make a deal with any asset. IFC Markets and its employees under any circumstances are not liable for any action taken by someone else during or after reading the overview.
