- Analytics
- Technical Analysis
Technical Analysis - Trading: 2014-11-28
Bearish expectations
Here we consider the EURUSD currency pair on the D1 chart. The price is moving in the limits of W1 and D1 bearish downtrend, containing the falling Donchian Channel. At the moment, we can observe the price retracement completion: the last bar peak of RSI-Bars oscillator is located on the border of the overbought zone, and that means a prompt price reversal is about to happen when the oscillator signal leaves the triangle area. Parabolic values are moving along the daily trend line, confirming the trend. Donchian Channel confirmation will be obtained after the support level breakout at 1.23505, located below last two Bill Williams fractals. This mark can be used for opening a pending sell order with Stop Loss placed above 1.26072. This level is confirmed by the upper Donchian Channel boundary and the last resistance fractal.
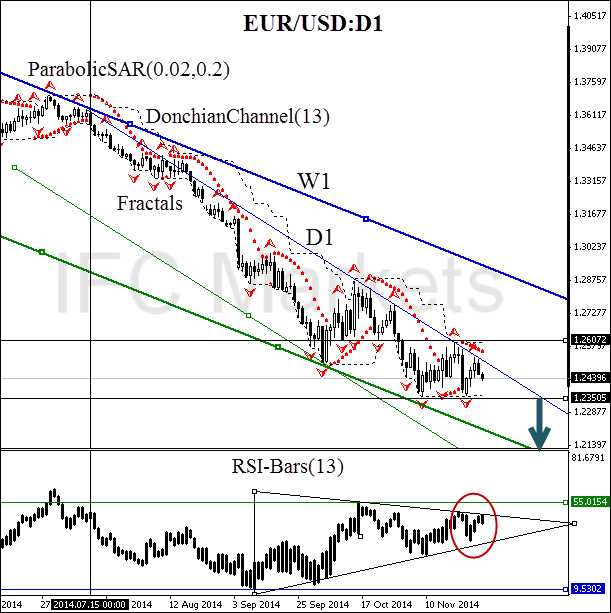
| Position | Sell |
| Sell stop | below 1.23505 |
| Stop loss | above 1.26072 |
Explore our
Trading Conditions
- Spreads from 0.0 pip
- 30,000+ Trading Instruments
- Stop Out Level - Only 10%
Ready to Trade?
Open Account Note:
This overview has an informative and tutorial character and is published for free. All the data, included in the overview, are received from public sources, recognized as more or less reliable. Moreover, there is no guarantee that the indicated information is full and precise. Overviews are not updated. The whole information in each overview, including opinion, indicators, charts and anything else, is provided only for familiarization purposes and is not financial advice or а recommendation. The whole text and its any part, as well as the charts cannot be considered as an offer to make a deal with any asset. IFC Markets and its employees under any circumstances are not liable for any action taken by someone else during or after reading the overview.
