- Analytics
- Technical Analysis
Rice Investments Technical Analysis - Rice Investments Trading: 2017-03-06
El Nino may affect rice crops in Asia
The El Nino weather phenomenon may have a negative effect on rice crops in South-Eastern Asia. Will its price increase?
The chances for the El Nino effect in August-October 2017 are 51%, according to U.S. Climate Prediction Center. The forecast will be updated in future. Meanwhile, the spread of rice price for export contracts has widened from $350-355 per tonne to $350-360. Thailand ranks 2nd in export rice after India. They are followed by Vietnam and Pakistan, which lag behind by far. Rice exports from Vietnam fell 17.2% in January-February compared to the same period of 2016 to 799 thousand tonnes. USDA predicts that global rice crops will be 480.1mln tonnes in 2016/17 which is 1.7% above the previous season estimate. At the same time, the global consumption may amount to 482mln tonnes which will push global rice stockpiles lower to 118mln tonnes.
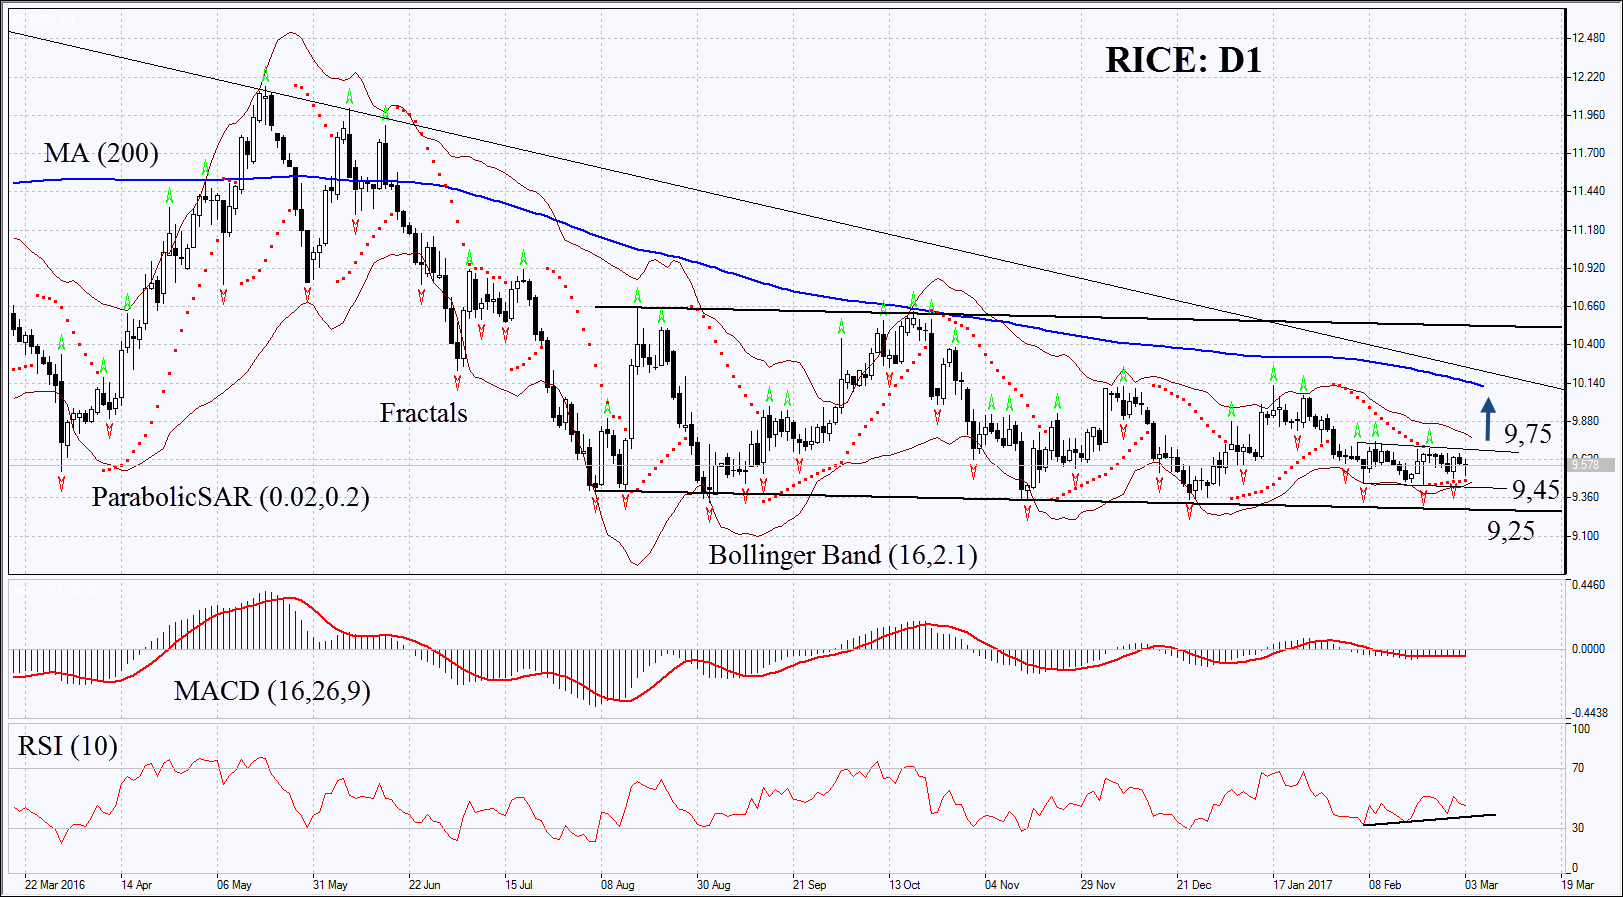
On the daily chart RICE: D1 has been moving sideways for 7 months. Is has been trading near its lower boundary. The further price increase is possible in case of lower forecast of harvest in South-Eastern Asia and in case of El Nino effects.
- The Parabolic indicator gives bullish signals.
- The Bollinger bands have narrowed a lot which means low volatility.
- The RSI is below 50. It has formed positive divergence.
- The MACD is giving weak bullish signals.
The bullish momentum may develop in case Rice surpasses the last fractal high at 9.75. This level may serve the point of entry. The initial stop-loss may be placed below the last fractal low, the lower Bollinger band and the Parabolic signal at 9.45. Having opened the pending order we shall move the stop to the next fractal low following the Parabolic and Bollinger signals. Thus, we are changing the probable profit/loss ratio to the breakeven point. The most risk-averse traders may switch to the 4-hour chart after the trade and place there a stop-loss moving it in the direction of the trade. If the price meets the stop-loss level at 9.45 or 9.25 without reaching the order at 9.75, we recommend cancelling the position: the market sustains internal changes which were not taken into account.
Summary of technical analysis
| Position | Buy |
| Buy stop | above 9.75 |
| Stop loss | below 9.45 or 9.25 |
Explore our
Trading Conditions
- Spreads from 0.0 pip
- 30,000+ Trading Instruments
- Stop Out Level - Only 10%
Ready to Trade?
Open Account Note:
This overview has an informative and tutorial character and is published for free. All the data, included in the overview, are received from public sources, recognized as more or less reliable. Moreover, there is no guarantee that the indicated information is full and precise. Overviews are not updated. The whole information in each overview, including opinion, indicators, charts and anything else, is provided only for familiarization purposes and is not financial advice or а recommendation. The whole text and its any part, as well as the charts cannot be considered as an offer to make a deal with any asset. IFC Markets and its employees under any circumstances are not liable for any action taken by someone else during or after reading the overview.
