- Analytics
- Technical Analysis
Soybean Trade Technical Analysis - Soybean Trade Trading: 2018-07-20
Cheaper soybean has become more attractive to buyers
US soybean prices have significantly fallen after the introduction of a 25% import tariff by the Chinese authorities within the framework of the trade war with the US. According to some market participants, it may again become attractive to consumers. Will soybean prices rise?
Buyers from China purchased 17% of the autumn US soybean harvest. Thus, despite the increase in duties, their share did not fall to zero. On average, over the past 10 years, it was 60% for the fall harvest in the US and more than 34% for the aggregate. According to the U.S. Agriculture Department, purchases by countries such as Pakistan, Mexico, Indonesia and Thailand have increased. In particular, Pakistan has recently purchased 200 thousand soybean of the 2018/19 harvest. In general, in June 2018, foreign consumers increased purchases of beans in the US by 27% or 8 million tons compared to June 2017. After the increase in duties, China switched to Brazilian soybean. Meanwhile, Brazil can acquire up to 1 million tons of soybean in the United States for its domestic market and the production of soybean oil and animal feed for farm animals and poultry.
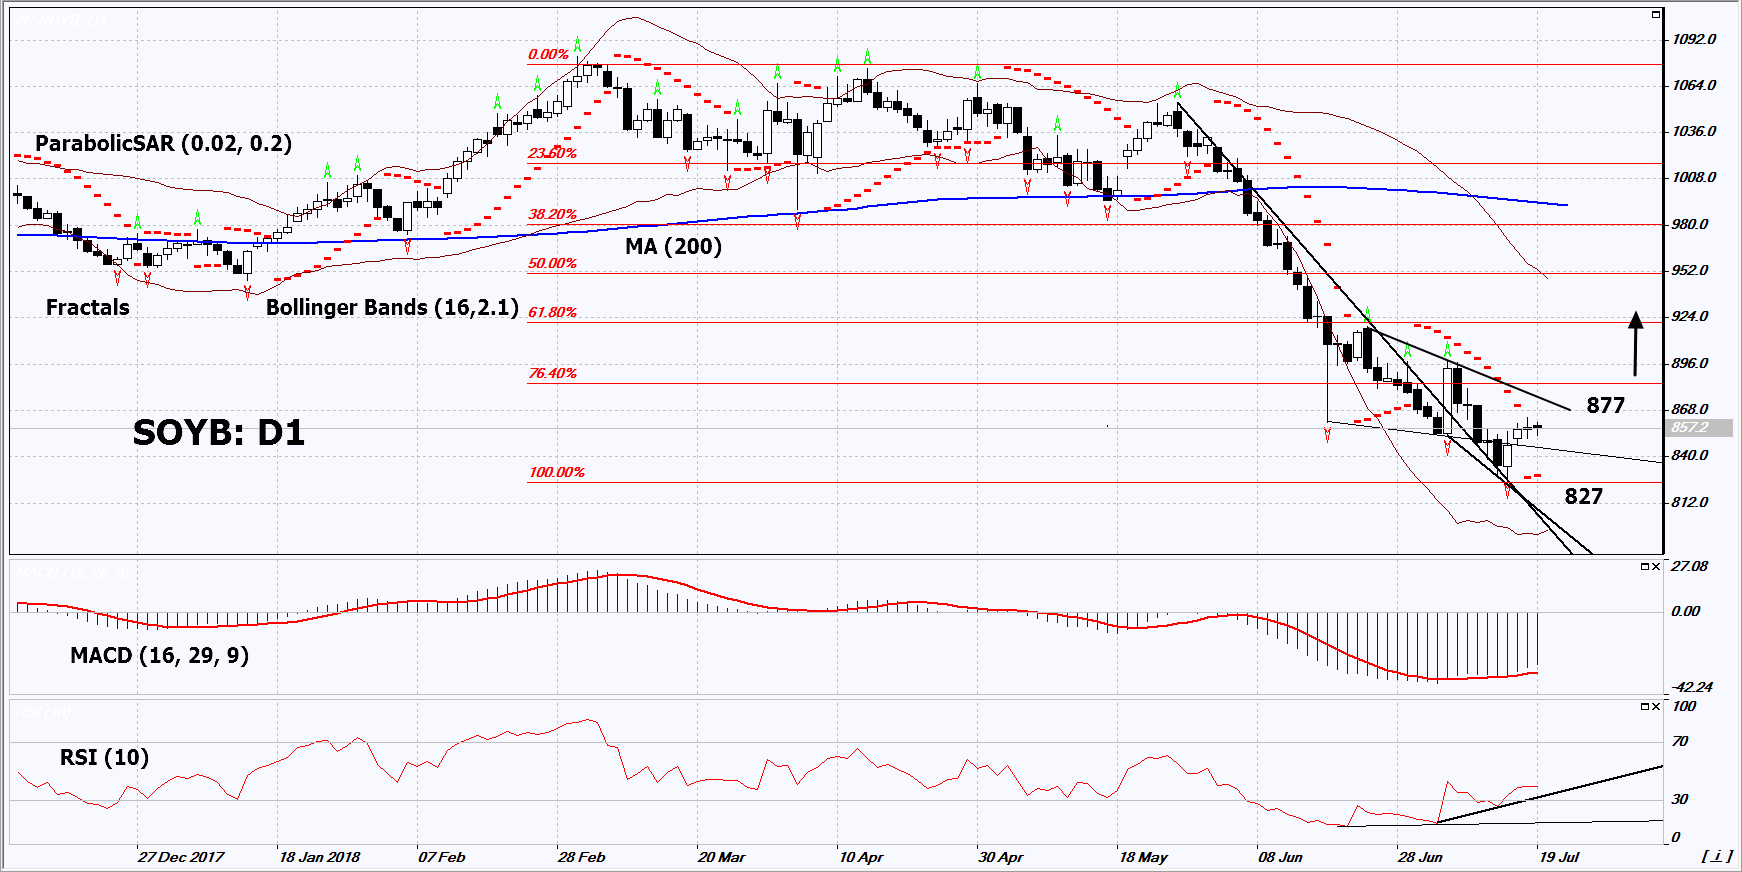
On the daily timeframe, SOYB: D1 updated the low since December 2008 and is trying to correct up. A number of technical analysis indicators formed buy signals. The further price increase is possible in case of the deterioration of weather conditions and reduction of the world harvest in the current season.
- The Parabolic indicator gives a bullish signal.
- The Bollinger bands have widened, which indicates high volatility. The lower band is titled upward.
- the RSI indicator is below 50. It has formed a positive divergence.
- the MACD indicator gives a bullish signal.
The bullish momentum may develop in case SOYB exceeds the resistance line of the downtrend at 877. This level may serve as an entry point. The initial stop loss may be placed below the last fractal low, the 10-year low and the Parabolic signal at 827. After opening the pending order, we shall move the stop to the next fractal low following the Bollinger and Parabolic signals. Thus, we are changing the potential profit/loss to the breakeven point. More risk-averse traders may switch to the 4-hour chart after the trade and place there a stop loss moving it in the direction of the trade. If the price meets the stop level (827) without reaching the order (877), we recommend to close the position: the market sustains internal changes that were not taken into account.
Summary of technical analysis
| Position | Buy |
| Buy stop | Above 877 |
| Stop loss | Below 827 |
Explore our
Trading Conditions
- Spreads from 0.0 pip
- 30,000+ Trading Instruments
- Stop Out Level - Only 10%
Ready to Trade?
Open Account Note:
This overview has an informative and tutorial character and is published for free. All the data, included in the overview, are received from public sources, recognized as more or less reliable. Moreover, there is no guarantee that the indicated information is full and precise. Overviews are not updated. The whole information in each overview, including opinion, indicators, charts and anything else, is provided only for familiarization purposes and is not financial advice or а recommendation. The whole text and its any part, as well as the charts cannot be considered as an offer to make a deal with any asset. IFC Markets and its employees under any circumstances are not liable for any action taken by someone else during or after reading the overview.
