- Analytics
- Technical Analysis
Soybean Trade Technical Analysis - Soybean Trade Trading: 2019-10-01
US Department of Agriculture Reduces Soybean Stock Assessment
China is going to increase purchases of American soybeans. Will the Soyb quotations grow?
On September 30, Chinese companies purchased 600 thousand tons of soybeans in the United States for delivery in November-January. This is slightly less than a week earlier, when 1 million tons were purchased. Market participants believe that purchases will continue. The acquisition of American soybeans is an important part of China’s commitment to the United States to end the trade war between the two countries, which has been going on for 15 months. Recall that the next round of US-Chinese trade negotiations may begin on October 10 or earlier. Safras & Mercado reported a delay in Brazil's soybean planting season in the 2019/20 growing season. As of September 27, only 0.9% of the planned area was sown, while a season earlier on the same date it was 4.9%. An additional positive factor for soybean quotations was the publication of a review of grain crops U.S. Department of Agriculture (USDA). Last year, the US bean crop was revised down to 4.428 billion bushels from 4.544 billion. At the same time, the USDA reduced the estimate of current soybean stocks in the United States to 913 million bushels, while market participants expected 982 million bushels.
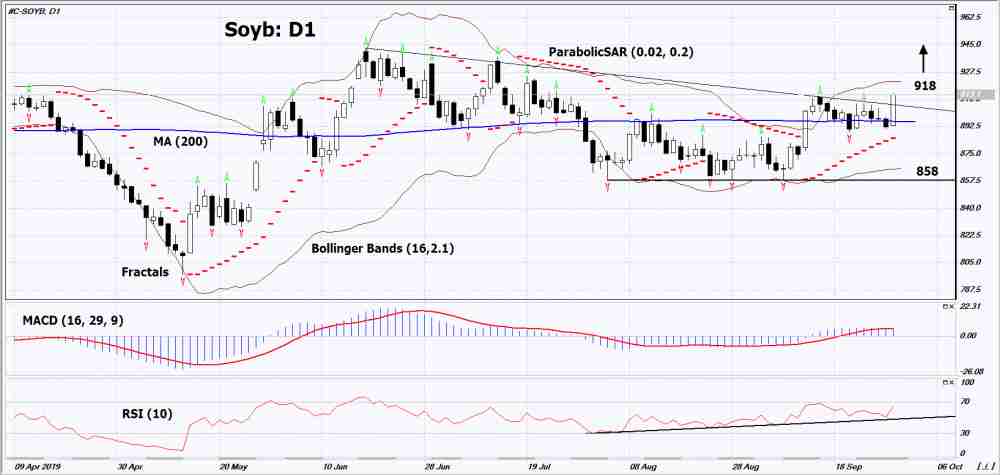
On the daily timeframeSoyb: D1 exceeded the 200-day moving average line. Various technical analysis indicators have generated uptrend signals. Further growth of quotations is possible in the event of a decrease in world crops and an increase in US soybean imports to China.
- The Parabolic indicator gives a bullish signal.
- The Bolinger bands narrowed, indicating volatility decrease. Both Bollinger Lines Slope Up.
- The RSI indicator is above the 50 mark. It has formed a divergence to increase.
- The MACD indicator shows uptrend signal.
The bullish momentum may develop if Soyb exceeds three of its last maximum: 918. This level can be used as an entry point. The initial stop lose may be placed below the last lower fractal, the lower Bollinger line, the 200-day moving average line and the Parabolic signal: 858. After opening a pending order, the stop shall be moved following the Bollinger and Parabolic signals to the next fractal minimum. Thus, we are changing the potential profit/loss to the breakeven point. More risk-averse traders may switch to the 4-hour chart after the trade and place a stop loss moving it in the direction of the trade. If the price meets the stop level (858) without reaching the order (918), we recommend to cancel the order: the market sustains internal changes that were not taken into account.
Technical Analysis Summary
| Position | Buy |
| Buy stop | Above 918 |
| Stop loss | Below 858 |
Explore our
Trading Conditions
- Spreads from 0.0 pip
- 30,000+ Trading Instruments
- Stop Out Level - Only 10%
Ready to Trade?
Open Account Note:
This overview has an informative and tutorial character and is published for free. All the data, included in the overview, are received from public sources, recognized as more or less reliable. Moreover, there is no guarantee that the indicated information is full and precise. Overviews are not updated. The whole information in each overview, including opinion, indicators, charts and anything else, is provided only for familiarization purposes and is not financial advice or а recommendation. The whole text and its any part, as well as the charts cannot be considered as an offer to make a deal with any asset. IFC Markets and its employees under any circumstances are not liable for any action taken by someone else during or after reading the overview.
