- Analytics
- Technical Analysis
Soybean Trade Technical Analysis - Soybean Trade Trading: 2023-06-20
Soybean Technical Analysis Summary
Above 1365
Buy Stop
Below 1190
Stop Loss
| Indicator | Signal |
| RSI | Neutral |
| MACD | Buy |
| MA(200) | Neutral |
| Fractals | Buy |
| Parabolic SAR | Buy |
| Bollinger Bands | Buy |
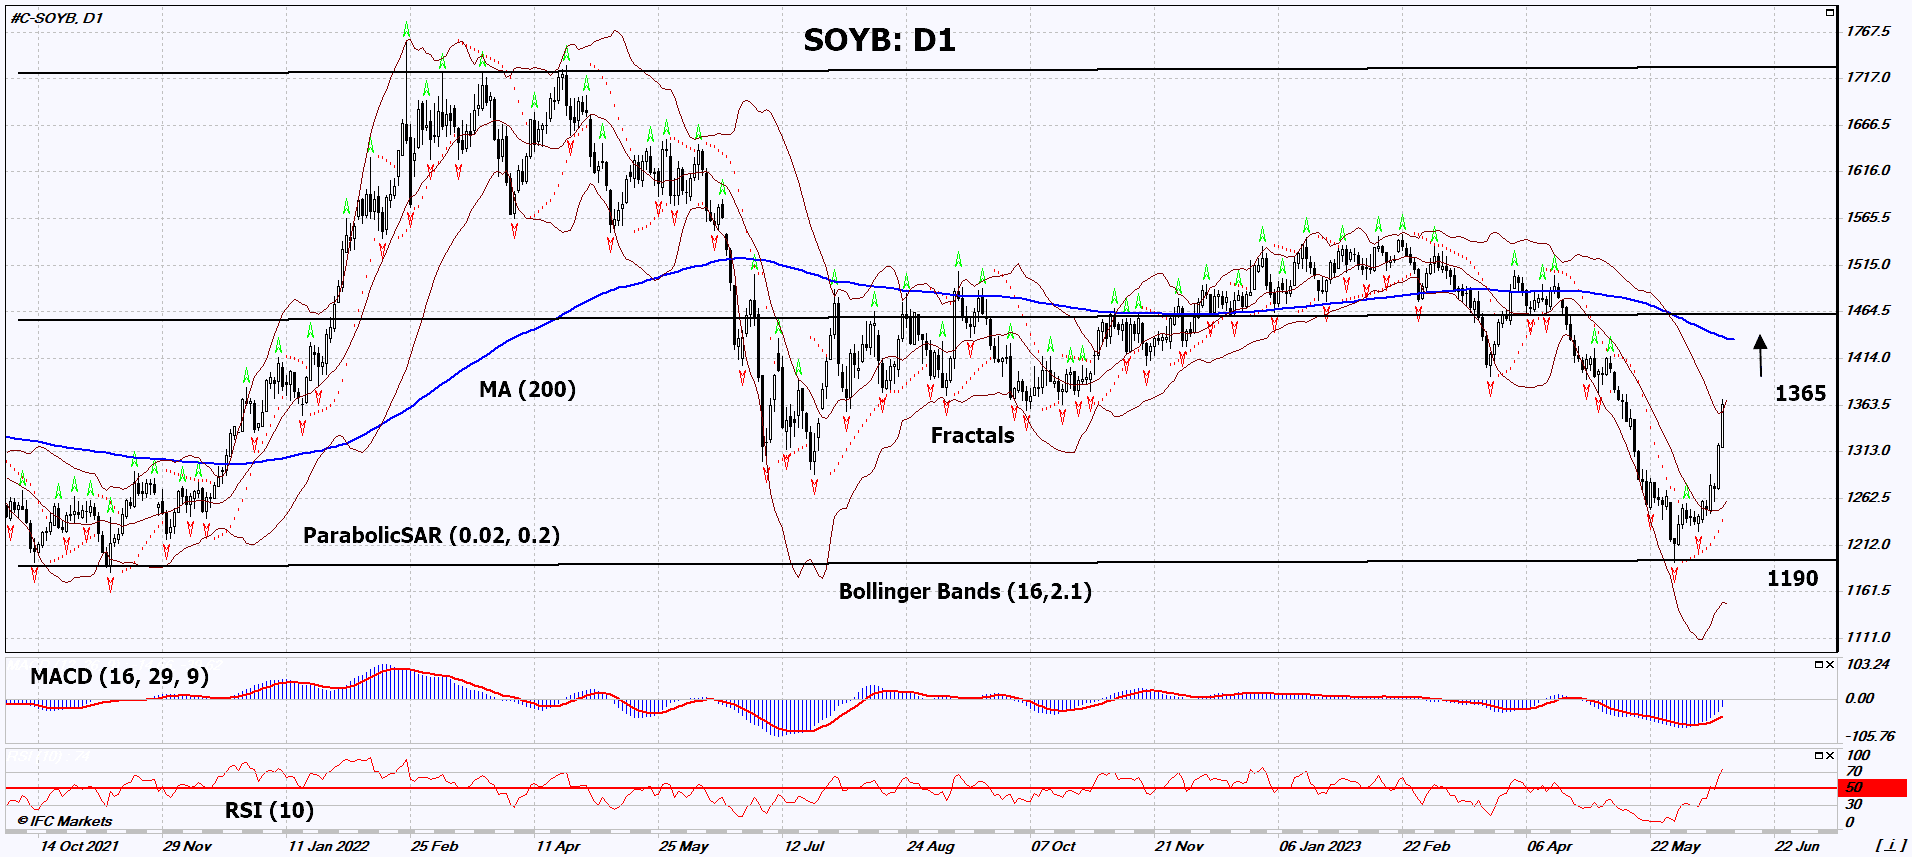
Soybean Chart Analysis
Soybean Technical Analysis
On the daily timeframe, SOYB: D1 failed to break down the lower boundary of the long-term neutral range and is now moving towards its upper boundary. A number of technical analysis indicators formed signals for further growth. We do not rule out a bullish movement if SOYB: D1 rises above the last high and upper Bollinger band: 1365. This level can be used as an entry point. The initial risk limit is possible below the Parabolic signal and the 2 (or 1st) last lower fractals: 1190 or 1225. After opening a pending order, we move the stop following the Bollinger and Parabolic signals to the next fractal low. Thus, we change the potential profit/loss ratio in our favor. The most cautious traders after making a trade can switch to a four-hour chart and set a stop loss, moving it in the direction of movement. If the price overcomes the stop level (1190 or 1225) without activating the order (1965), it is recommended to delete the order: there are internal changes in the market that were not taken into account.
Fundamental Analysis of Commodities - Soybean
A global drought could cut crop yields. Will SOYB quotes continue to grow?
Commodity exchanges in the US did not work on June 19 due to the Juneteenth holiday. The reasons for the possible rise in price of SOYB coincide with the previous review devoted to the dynamics of SOYBM. Severe drought is observed in the US states of Minnesota, Indiana, Illinois, Iowa. This could reduce the production of soybeans and soy products in the US.
Explore our
Trading Conditions
- Spreads from 0.0 pip
- 30,000+ Trading Instruments
- Stop Out Level - Only 10%
Ready to Trade?
Open Account Note:
This overview has an informative and tutorial character and is published for free. All the data, included in the overview, are received from public sources, recognized as more or less reliable. Moreover, there is no guarantee that the indicated information is full and precise. Overviews are not updated. The whole information in each overview, including opinion, indicators, charts and anything else, is provided only for familiarization purposes and is not financial advice or а recommendation. The whole text and its any part, as well as the charts cannot be considered as an offer to make a deal with any asset. IFC Markets and its employees under any circumstances are not liable for any action taken by someone else during or after reading the overview.

