- Analytics
- Technical Analysis
USD JPY Technical Analysis - USD JPY Trading: 2015-08-10
Trend continues
Let us consider the USD/JPY currency pair on the daily chart. The price has been moving within an ascending corridor, confirmed by the Parabolic indicator and the Donchian channel. The RSI-Bars oscillator does not contradict our assumptions: it has shaped an uptrend channel.
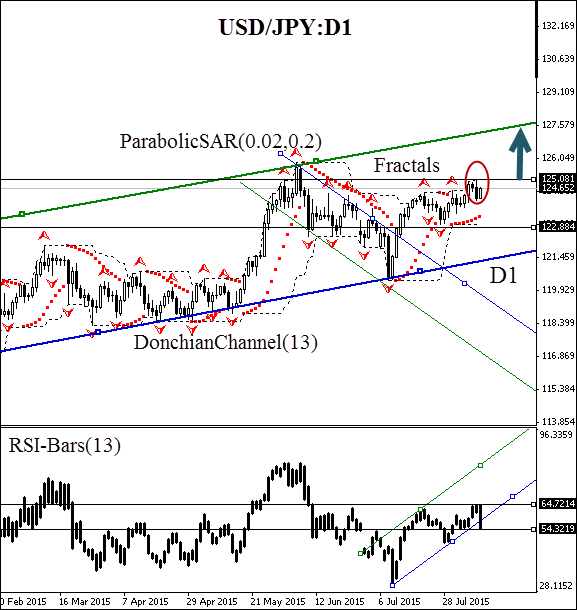
We may place a buy pending order at 125.081. A stop loss can be placed at the Donchian channel opposite boundary at 122.884. This level is supported by Parabolic indicator historical values and the Bill Williams fractal. Conservative traders are recommended to wait until the oscillator support line is breached at 64%. The stop loss is supposed to be moved every day to the next fractal low, following Parabolic signals. Thus, we are changing the probable profit/loss ratio to the breakeven point.
| Position | Buy |
| Buy stop | above 125.081 |
| Stop loss | below 122.884 |
Explore our
Trading Conditions
- Spreads from 0.0 pip
- 30,000+ Trading Instruments
- Stop Out Level - Only 10%
Ready to Trade?
Open Account Note:
This overview has an informative and tutorial character and is published for free. All the data, included in the overview, are received from public sources, recognized as more or less reliable. Moreover, there is no guarantee that the indicated information is full and precise. Overviews are not updated. The whole information in each overview, including opinion, indicators, charts and anything else, is provided only for familiarization purposes and is not financial advice or а recommendation. The whole text and its any part, as well as the charts cannot be considered as an offer to make a deal with any asset. IFC Markets and its employees under any circumstances are not liable for any action taken by someone else during or after reading the overview.

