- Analytics
- Technical Analysis
USD JPY Technical Analysis - USD JPY Trading: 2019-07-08
Bank of Japan does not rule out further rate cuts
Masayoshi Amamiya, Deputy Governor of the Bank of Japan, said that his department could further reduce the negative rate if it is needed to stimulate the economy. Will the USDJPY quotations grow?
Such a move indicates the weakening of the yen against the US dollar. The rate of the Bank of Japan is now -0.1% with annual inflation + 0.7%. At the same time, the target inflation rate is much higher and amounts to + 2%. Japan's GDP growth in the 1st quarter of 2019 was + 2.2% in annual terms. The Bank of Japan strives to keep it at this high level and expresses its readiness for an additional rate cut, if necessary. Such a monetary policy may contribute to the weakening of the yen. The US dollar index rose significantly due to the publication of good data on the US labor market in June. The number of new jobs (Non-farm payrolls) exceeded forecasts and turned out to be the maximum in 5 months. The Fed rate is now 2.5%. According to all forecasts, it will be reduced by 0.25% at the next meeting on July 31.
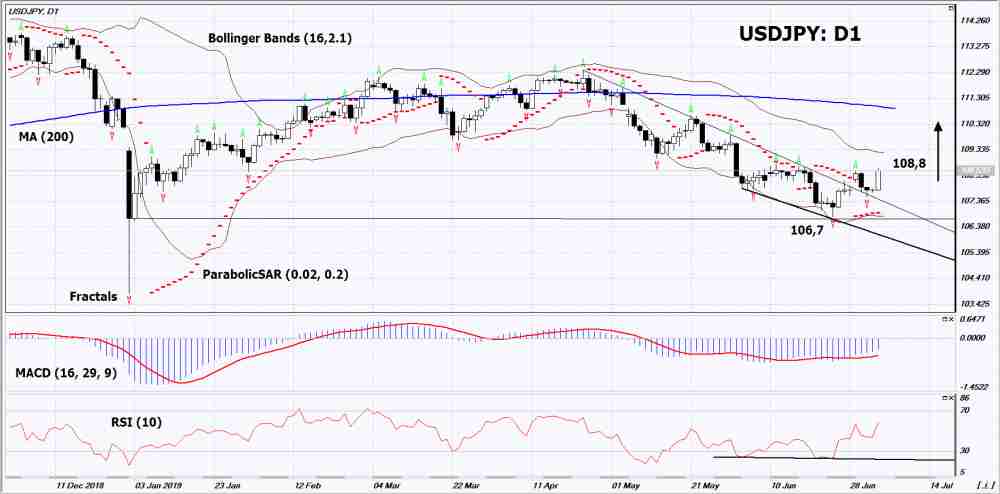
On the daily timeframe USDJPY: D1 came out of the downtrend. Various technical analysis indicators have generated uptrend signals. Further growth of quotes is possible in case of publication of negative macroeconomic data in Japan and positive in the United States.
- The Parabolic indicator indicates uptrend signal.
- The Bolinger bands narrowed, indicating volatility decrease . The bottom line of Bollinger has a slope up.
- The RSI indicatoris above the 50 mark. It formed a weak divergence to the rise.
- The MACD indicator gives bullish signal.
The bullish momentum may develop if USDJPY exceeds the last 3 upper fractals: 108.8. This level can be used as an entry point. This level can be used as an entry point. The initial stop loss can be placed below the signal of the Parabolic, the lower fractal and the lower Bollinger line: 106.7. After placing the pending order, the stop loss shall be moved following the signals of Bollinger and Parabolic to the next fractal minimum. Thus, we are changing the potential profit/loss to the breakeven point. More risk-averse traders may switch to the 4-hour chart after the trade and place a stop loss moving it in the direction of the trade. If the price meets the stop level (106,7) without reaching the order (108,8), we recommend to cancel the order: the market sustains internal changes that were not taken into account.
Technical Analysis Summary
| Position | Buy |
| Buy stop | Above 108,8 |
| Stop loss | Below 106,7 |
Explore our
Trading Conditions
- Spreads from 0.0 pip
- 30,000+ Trading Instruments
- Stop Out Level - Only 10%
Ready to Trade?
Open Account Note:
This overview has an informative and tutorial character and is published for free. All the data, included in the overview, are received from public sources, recognized as more or less reliable. Moreover, there is no guarantee that the indicated information is full and precise. Overviews are not updated. The whole information in each overview, including opinion, indicators, charts and anything else, is provided only for familiarization purposes and is not financial advice or а recommendation. The whole text and its any part, as well as the charts cannot be considered as an offer to make a deal with any asset. IFC Markets and its employees under any circumstances are not liable for any action taken by someone else during or after reading the overview.
