- Analytics
- Technical Analysis
AUD USD Technical Analysis - AUD USD Trading: 2016-01-14
Australian dollar under pressure
Australian dollar has been weakening with slowdown in China’s growth. The trade report on Wednesday indicated China’s foreign trade contracted less than expected. Will the Australian dollar continue weakening?
The Reserve Bank of Australia (RBA) left the interest rate unchanged at 2.0% at its December 1 policy meeting. The central bank indicated the GDP growth was moderate as key commodity prices were much lower than a year ago due to increased global supply, including Australia, as well as weaker demand. The accommodative monetary policy that had resulted in weaker currency promoted exports, which was the main source of the 0.9% GDP growth in the September quarter compared to a 0.3% growth in the second quarter. According to the labor market Thursday report unemployment held stable at 5.8% as the labor market lost 1000 jobs compared to the previous month. The slowdown of China’s economy, which accounted for 28.3% of Australia’s exports in 2014-2015, is one of the main drags for Australia’s economic growth. The selloff in China’s stock markets intensified in the new year, causing global equities’ rout and reinforcing concerns about slowdown in China. While trade data released on Wednesday showed the 1.4% fall in Chinese exports in December from a year earlier was less-than-expected, imports fell 7.6%, the 14th consecutive monthly decline. Falling merchandise trade indicates slowing growth. We believe the Australian dollar dynamics will depend on further pace of China’s economic growth as the risk of the Chinese economic slowdown is a major factor contributing to Australian dollar’s weakness. On January 19 China’s GDP and industrial production data will be released, the next day the Westpac-Melbourne Institute Consumer Sentiment Index will come out. And on February 2 the RBA will announce the interest rate decision, a day before December merchandise balance will be published.
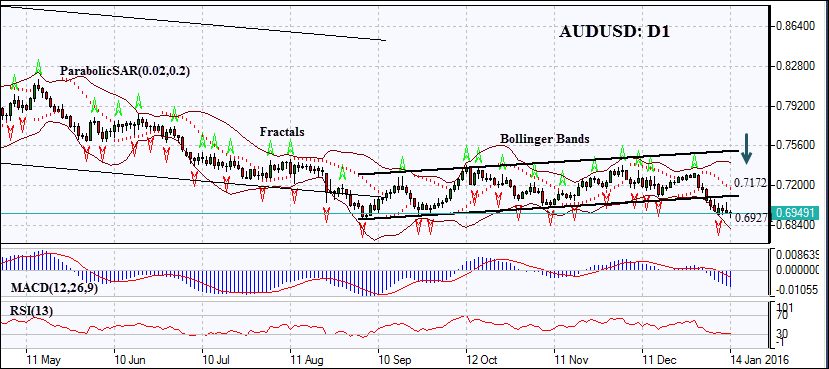
The AUD/USD had been edging up within an uptrend channel for the last three and half months. The pair started falling since the start of the new year with the rout in Chinese stock market. It has breached the lower channel and the Parabolic indicator gives a sell signal. The Bollinger bands have expanded which indicates increased volatility. The RSI oscillator is falling and has reached the oversold zone, which doesn’t exclude continuation of the downtrend. The MACD indicator is below the signal line and the zero level which is a bearish signal. We believe the closing below the fractal low at 0.69271 will signify the continuation of bearish momentum. A pending order to sell can be placed below that level. The stop loss can be placed above the lower channel and Parabolic signal at 0.7172. After placing the order, the stop loss is to be moved every day to the next fractal high, following Parabolic signals. Thus, we are changing the probable profit/loss ratio to the breakeven point. The most risk-averse traders may switch to the 4-hour chart after the trade and place there a stop-loss moving it in the direction of the trade. If the price meets the stop loss level at 0.7172 without reaching the order, we recommend cancelling the position: the market sustains internal changes which were not taken into account.
| Position | Sell |
| Sell stop | below 0.69271 |
| Stop loss | above 0.7172 |
- Get Certificate

Note:
This overview has an informative and tutorial character and is published for free. All the data, included in the overview, are received from public sources, recognized as more or less reliable. Moreover, there is no guarantee that the indicated information is full and precise. Overviews are not updated. The whole information in each overview, including opinion, indicators, charts and anything else, is provided only for familiarization purposes and is not financial advice or а recommendation. The whole text and its any part, as well as the charts cannot be considered as an offer to make a deal with any asset. IFC Markets and its employees under any circumstances are not liable for any action taken by someone else during or after reading the overview.
