- Analytics
- Technical Analysis
EUR CHF Technical Analysis - EUR CHF Trading: 2018-09-25
Inflation may accelerate in the Eurozone
Mario Draghi, president of the ECB, said that he expects inflation to accelerate in the Eurozone. Amid this, the euro rose to a 3-and-a-half-month high against the US dollar. Will the EURCHF rise? Their increase means the strengthening of the euro against the Swish franc.
The strengthening of the euro occurs due to market participants’ expectations that the ECB will begin to tighten monetary policy alongside with the increase in inflation. Mario Draghi confirmed the plans of his department to reduce the volume of asset purchase within the framework of the current quantitative easing program from 30 billion euros a month to 15 billion euros in October 2018. The program itself must be completed this year. Unlike the ECB, the National Bank of Switzerland (NBS) said at its regular meeting on September 20 that it was not going to raise the rate and would continue its ultra-loose monetary policy. Let us recall that the SNB rate is the lowest in the world and is minus 0.75% with +1.2% inflation. The ECB rate is zero with + 2% inflation. Preliminary data on inflation (HICP index) in the Eurozone for September will be published on September 28. The consumer price index in Switzerland will be released on October 5. These data may affect the dynamics of the EURCHF currency pair.
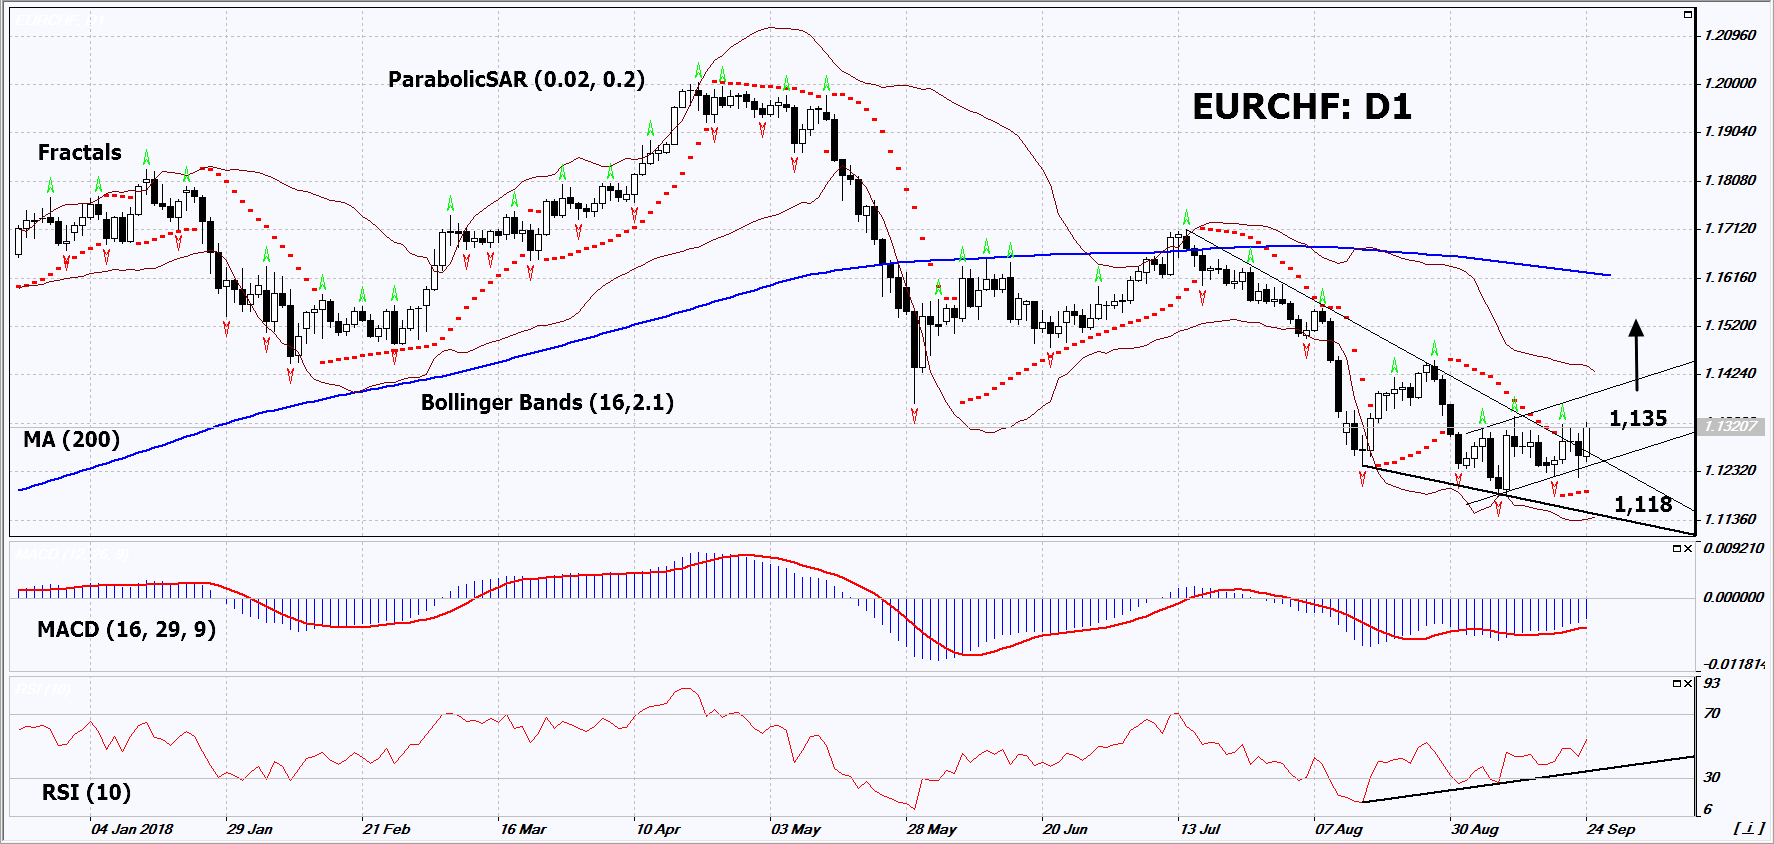
On the daily timeframe, EURCHF: D1 exceeded the resistance line of the falling channel. A number of technical analysis indicators formed buy signals. The further price increase is possible in case of an increase in inflation in the Eurozone and the statements of the ECB about the possible tightening of the monetary policy.
- The Parabolic indicator gives a bullish signal.
- The Bollinger bands have narrowed, which indicates low volatility. The lower band is titled upward.
- The RSI indicator is above 50. It has formed a positive divergence.
- The MACD indicator gives a bullish signal.
The bullish momentum may develop in case EURCHF exceeds the three last fractal highs at 1.135. This level may serve as an entry point. The initial stop loss may be placed below the two last fractal lows, the 14-month low and the Parabolic signal at 1.118. After opening the pending order, we shall move the stop to the next fractal low following the Bollinger and Parabolic signals. Thus, we are changing the potential profit/loss to the breakeven point. More risk-averse traders may switch to the 4-hour chart after the trade and place there a stop loss moving it in the direction of the trade. If the price meets the stop level (1.118) without reaching the order (1.134), we recommend to close the position: the market sustains internal changes that were not taken into account.
Summary of technical analysis
| Position | Buy |
| Buy stop | Above 1.135 |
| Stop loss | Below 1.118 |
- Get Certificate

Note:
This overview has an informative and tutorial character and is published for free. All the data, included in the overview, are received from public sources, recognized as more or less reliable. Moreover, there is no guarantee that the indicated information is full and precise. Overviews are not updated. The whole information in each overview, including opinion, indicators, charts and anything else, is provided only for familiarization purposes and is not financial advice or а recommendation. The whole text and its any part, as well as the charts cannot be considered as an offer to make a deal with any asset. IFC Markets and its employees under any circumstances are not liable for any action taken by someone else during or after reading the overview.
