- Analytics
- Technical Analysis
FR 40 Technical Analysis - FR 40 Trading: 2018-01-29
The strengthening of the euro may worsen European economic indicators
The significant strengthening of the euro may have a negative impact on the European exports and industrial production. The French economic growth lags behind the eurozone economy as a whole. Will the САС 40 quotes decline?
France GDP in the Q3 of 2017 grew by 2.2% in annual terms, while the eurozone GDP - by 2.6%. The current account balance in France was minus 3.3 bln euros in November, and that of the eurozone - plus 37.8 bln euros. Other French economic indicators also look weaker than the pan-European ones. At the same time, over the last 3 months the CAC 40 index rose by 1.3%, and the pan-European ESTOXX 50 - by 0.3%.
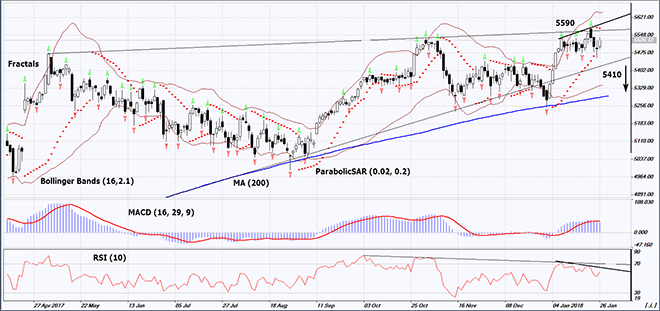
On the daily timeframe, FR40: D1 is in the rising trend. It needs to breach down the support line in order to open a Sell position. A complete downward correction is possible in case of making a profit.
- The Parabolic indicator gives a bearish signal.
- The Bollinger bands have markedly widened, which means higher volatility.
- The RSI indicator is above 50. It has formed a negative divergence.
- The MACD indicator gives a bearish signal.
The bullish momentum may develop in case FR40 drops below the support line of the rising trend at 5410. This level may serve as an entry point. The initial stop loss may be placed above the last fractal high, the Parabolic signal and the 10-year high at 5590. After opening the pending order, we shall move the stop to the next fractal high following the Bollinger and Parabolic signals. Thus, we are changing the potential profit/loss to the breakeven point. More risk-averse traders may switch to the 4-hour chart after the trade and place there a stop loss moving it in the direction of the trade. If the price meets the stop level at 5590 without reaching the order at 5410, we recommend cancelling the position: the market sustains internal changes that were not taken into account.
Summary of technical analysis
| Position | Sell |
| Sell stop | below 5410 |
| Stop loss | above 5590 |
- Get Certificate

Note:
This overview has an informative and tutorial character and is published for free. All the data, included in the overview, are received from public sources, recognized as more or less reliable. Moreover, there is no guarantee that the indicated information is full and precise. Overviews are not updated. The whole information in each overview, including opinion, indicators, charts and anything else, is provided only for familiarization purposes and is not financial advice or а recommendation. The whole text and its any part, as well as the charts cannot be considered as an offer to make a deal with any asset. IFC Markets and its employees under any circumstances are not liable for any action taken by someone else during or after reading the overview.
