- Analytics
- Technical Analysis
NZD USD Technical Analysis - NZD USD Trading: 2016-08-19
New Zealand dollar strength endures
The New Zealand dollar has been strengthening since the end of January. The Reserve Bank of New Zealand cut the interest rates 0.25 percentage points to 2.0% at August 11 meeting and indicated further easing stance. Will the New Zealand dollar continue strengthening?
The Reserve Bank of New Zealand cut the Official Cash Rate by 25 basis points to 2.0% at its August 11 meeting. The central bank had left the rates unchanged at June and April meetings following an unexpected 0.25 percentage point cut in March after four rate cuts in 2015. The RBNZ stated it expects New Zealand’s economic growth will be supported by construction activity, tourism, strong inward migration and accommodative monetary policy while global economic outlook remained weak despite accommodative monetary policies in many countries. Low prices for exports, particularly for its major export concentrated milk, resulted in negative current account balances in the last three quarters of 2015 which turned to $1.3 billion surplus in the first quarter of 2016. Low export prices discourage business investment and growing migration restrains wage growth, both contributing to low inflation. Inflation in the second quarter rose to 0.4% from 0.2% in the first quarter, well below the central bank’s 1% to 3% target band. The central bank stated further policy easing will be required to ensure that future inflation settles near the middle of the target range. Recent labor market data indicated unemployment fell to 5.1% in the second quarter from 5.2% as labor force participation rate rose to 69.7% from 68.8%. At the same time retail sales grew 2.3% in the second quarter over the previous quarter, the highest rate in over five years. If sustained such a positive dynamic will be bullish for the kiwi dollar. On August 24 July balance of trade will be released and on August 31 July Australia and New Zealand Bank Business Confidence index for July will be published.
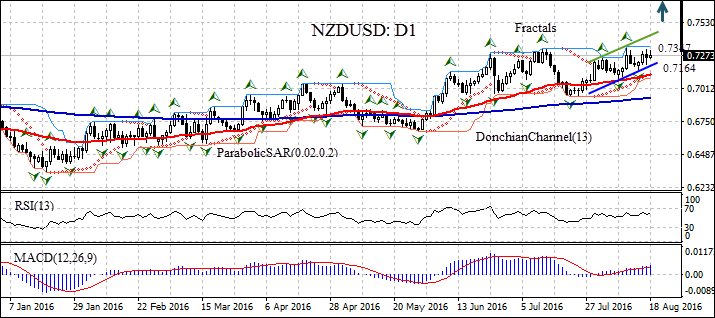
NZDUSD has been trading with upside bias since the end of January. The pair is retracing after pulling back from 19 month high following the central bank’s interest rate decision. It is above the 50-day moving average MA(50) which is rising above the 200-day moving average MA(200). The Parabolic indicator gives a buy signal. The Donchian channel is tilted upward indicating uptrend. The RSI oscillator is rising but hasn’t reached the overbought zone. The MACD indicator is above the signal line and the zero level which and the gap is rising which is also a bullish signal. We believe the bullish momentum will continue after the price closes above the last fractal high and upper Donchian channel at 0.7347. A pending order to buy can be placed above that level. The stop loss can be placed below the last fractal low at 0.7164. After placing the pending order the stop loss is to be moved every day to the next fractal low, following Parabolic signals. Thus, we are changing the probable profit/loss ratio to the breakeven point. If the price meets the stop loss level (0.7347) without reaching the order (0.7164), we recommend cancelling the position: the market sustains internal changes which were not taken into account.
| Position | Buy |
| Buy stop | above 0.7347 |
| Stop loss | below 0.7167 |
- Get Certificate

Note:
This overview has an informative and tutorial character and is published for free. All the data, included in the overview, are received from public sources, recognized as more or less reliable. Moreover, there is no guarantee that the indicated information is full and precise. Overviews are not updated. The whole information in each overview, including opinion, indicators, charts and anything else, is provided only for familiarization purposes and is not financial advice or а recommendation. The whole text and its any part, as well as the charts cannot be considered as an offer to make a deal with any asset. IFC Markets and its employees under any circumstances are not liable for any action taken by someone else during or after reading the overview.
