- Analytics
- Technical Analysis
Rice Investments Technical Analysis - Rice Investments Trading: 2016-09-06
Weather affects rice prices
International Grains Council lowered forecast for global rice crops in 2016 in its August report to 484mln tonnes from 487mln tonnes in previous month. Despite their decline, the crops are expected to surpass 473mln tonnes of 2015. In previous week rice prices hit a fresh 15-month low. Now they are slightly advancing. Markets worry the Thai crops may suffer from floods. Will rice prices rise?
At the start of the current agricultural season Thailand suffered from drought. The rice crops in Thailand may fall to 20mln tonnes from 25mln tonnes in previous season, according to forecasts. Previously the Thailand rice subsidy scheme existed. The government used to purchase rice from farmers for state reserves. Now this program has expired but reserves have reached the level of 20mln tonnes which is more than twofold above the annual volume of rice exports from Thailand. News on sales from Thai state reserves will destabilize the global rice market. The Thai Rice Exporters Association expects the rice exports to be 9.5mln tonnes this year. In Q1 they rose 12% compared to the same period of 2015. The news that rice production fell by 2.7% to 32.8mln tonnes in China and that Philippines are planning to purchase 1mln tonnes of rice in global markets support the rice prices.
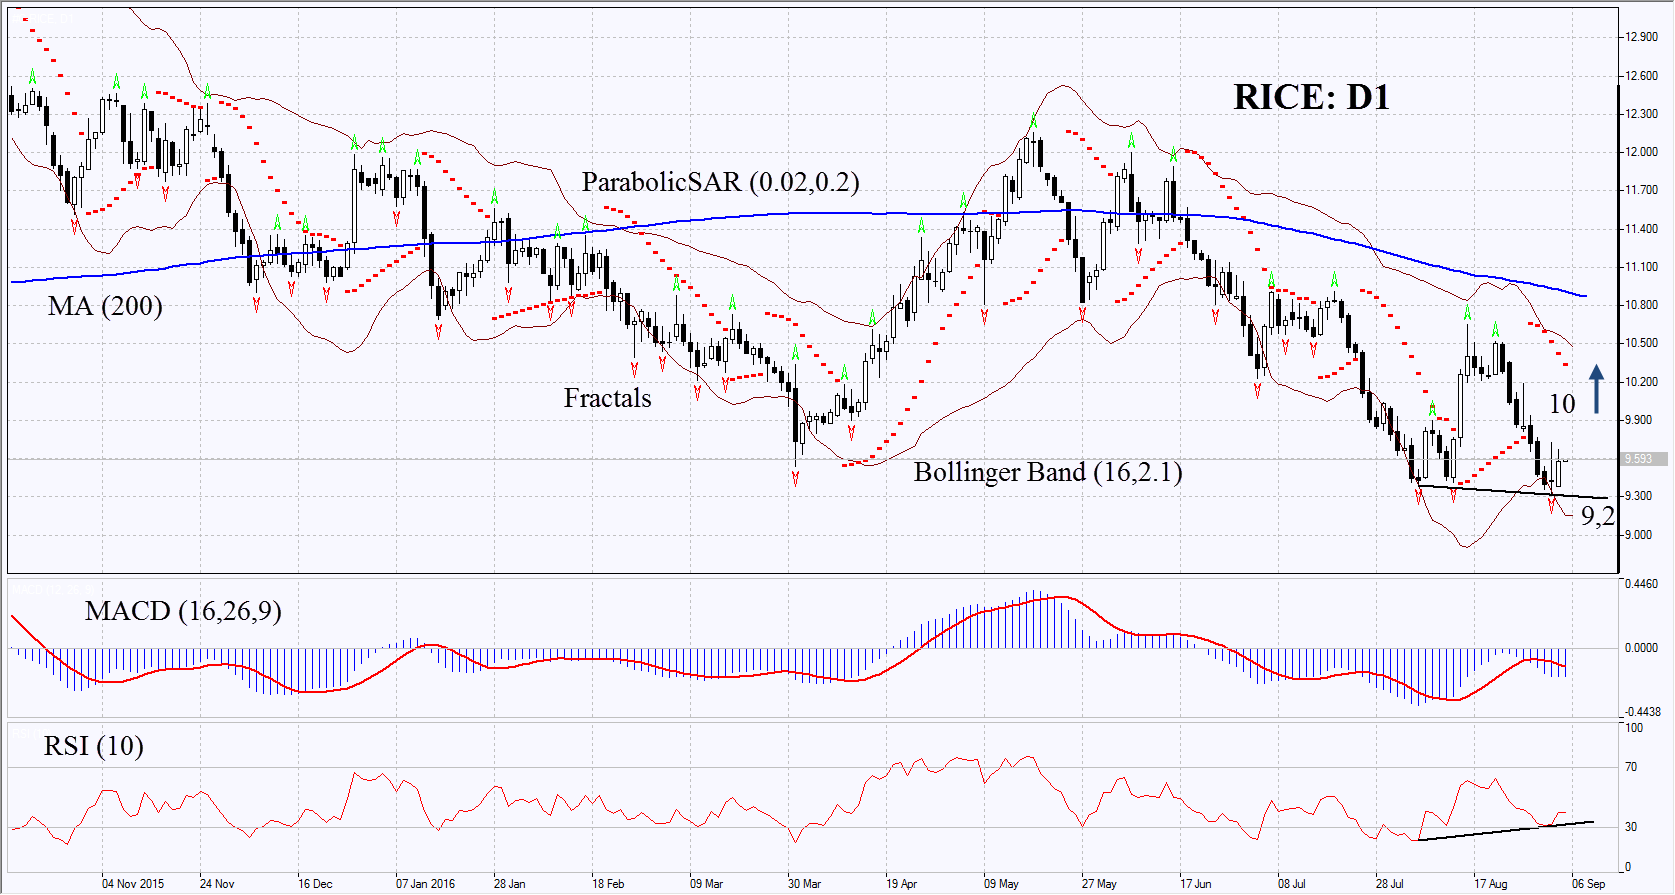
On the daily chart RICE: D1 has hit a fresh 15-month low and its decline has halted. Now it is moving sideways. In theory the double bottom technical analysis technical pattern may form in the chart. This will happen in case the weather conditions further worsen in South-East Asia and Louisiana and Arkansas states in US.
- Parabolic indicator gives bearish signals.
- Bollinger bands have contracted which means lower volatility.
- RSI us below 50 and has formed positive divergence.
- MACD gives bearish signals.
The bullish momentum may develop in case RICE surpasses 10. In such a case Parabolic and MACD will reverse up. This level may serve the point of entry. The initial stop-loss may be placed below the last fractal low and 6-year low at 9.2. Having opened the pending order we shall move the stop to the next fractal low following the Parabolic and Bollinger signals. Thus, we are changing the probable profit/loss ratio to the breakeven point. The most risk-averse traders may switch to the 4-hour chart after the trade and place there a stop-loss moving it in the direction of the trade. If the price meets the stop-loss level at 9.2 without reaching the order at 10, we recommend cancelling the position: the market sustains internal changes which were not taken into account.
Technical Analysis Summary
| Position | Buy |
| Buy stop | above 10 |
| Stop loss | below 9.2 |
- Get Certificate

Note:
This overview has an informative and tutorial character and is published for free. All the data, included in the overview, are received from public sources, recognized as more or less reliable. Moreover, there is no guarantee that the indicated information is full and precise. Overviews are not updated. The whole information in each overview, including opinion, indicators, charts and anything else, is provided only for familiarization purposes and is not financial advice or а recommendation. The whole text and its any part, as well as the charts cannot be considered as an offer to make a deal with any asset. IFC Markets and its employees under any circumstances are not liable for any action taken by someone else during or after reading the overview.
