- Analytics
- Technical Analysis
S&P 500 Technical Analysis - S&P 500 Trading: 2018-11-02
Strong labor market data bullish for SP500
US new jobs grew and worker compensation remained at 10-year high in September. Will the SP500 recovery continue?
Recent US economic data were positive: the employment cost index remained at 2.8% over year in September, a 10-year high. Private sector wages and salaries grew even faster: 3.1% over year. The private sector added more new jobs in October than expected - 227,000 versus 202,000 forecast, according to payroll firm Automatic Data Processing. And a week earlier the Bureau of Economic Analysis reported the US economic growth slowed less than expected in the third quarter: GDP grew 3.5% after 4.2% over year growth in the second quarter when a 3.3% expansion was forecast. Positive US data are bullish for SP500. However a weaker than expected October nonfarm payrolls report, due today at 14:30 CET is a downside risk which may weigh on US growth prospects.
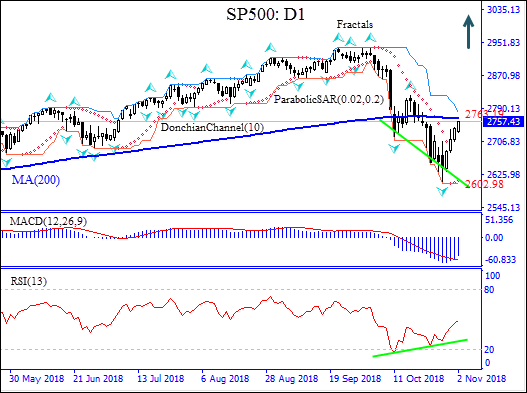
On the daily timeframe SP500: D1 is poised to test the 200-day moving average MA(200) from below.
- The Parabolic indicator has formed a buy signal.
- The Donchian channel indicates downtrend: it is tilted lower.
- The MACD indicator is below the signal line with the gap narrowing. This is a bullish signal.
- The RSI indicator has developed a bullish divergence.
We believe the bullish momentum will continue after the price breaches above the MA(200) at 2763.19. This level can be used as an entry point for placing a pending order to buy. The stop loss can be placed below the lower Donchian channel at 2602.98. After placing the pending order the stop loss is to be moved every day to the next fractal low, following Parabolic signals. Thus, we are changing the expected profit/loss ratio to the breakeven point. If the price meets the stop-loss level (2602.98) without reaching the order (2963.19) we recommend cancelling the order: the market sustains internal changes which were not taken into account.
Technical Analysis Summary
| Position | Buy |
| Buy Stop | Above 2763.19 |
| Stop loss | Below 2602.98 |
- Get Certificate

Note:
This overview has an informative and tutorial character and is published for free. All the data, included in the overview, are received from public sources, recognized as more or less reliable. Moreover, there is no guarantee that the indicated information is full and precise. Overviews are not updated. The whole information in each overview, including opinion, indicators, charts and anything else, is provided only for familiarization purposes and is not financial advice or а recommendation. The whole text and its any part, as well as the charts cannot be considered as an offer to make a deal with any asset. IFC Markets and its employees under any circumstances are not liable for any action taken by someone else during or after reading the overview.
