- Analytics
- Technical Analysis
USD CHF Technical Analysis - USD CHF Trading: 2016-03-29
Switzerland earned 1.2bn Swiss francs on negative interest rates
Swiss National Bank (SNB) set negative deposit rates at -0.75% early in 2015 and generated 1.2bn Swiss francs on that. Thus, the Swiss banks depositors lost this amount of money. On the last meeting the Swiss National Bank left the rates unchanged and cut the forecast of Swiss economic expansion for this year from 1.5% expected in December to 1-1.5%. Will the Swiss franc continue weakening? It looks as the upside movement on the dollar-franc chart.
Swiss National Bank not only adopted a negative rate policy, but also intervened last year wall-to-wall to weaken the franc and purchased 86.1bn Swiss francs in foreign currencies. The next SNB meeting is scheduled on June 16. Until the date the high negative rates are in place. Meanwhile the economic indicators of Switzerland are not that splendid. The GDP growth in Q4 2015 slowed down to 0.4% year on year which is the lowest since Q4 2009. We believe the March inflation data to be released on April 8 may affect the Swiss franc rate. Before that, on April 1 the less important February retail sales will come out. The USDCHF exchange rate may be affected by the US labour market data on Friday. The pair strengthening, or franc weakening, is probable in case the March Non-farm Payrolls exceed 200 thousand.
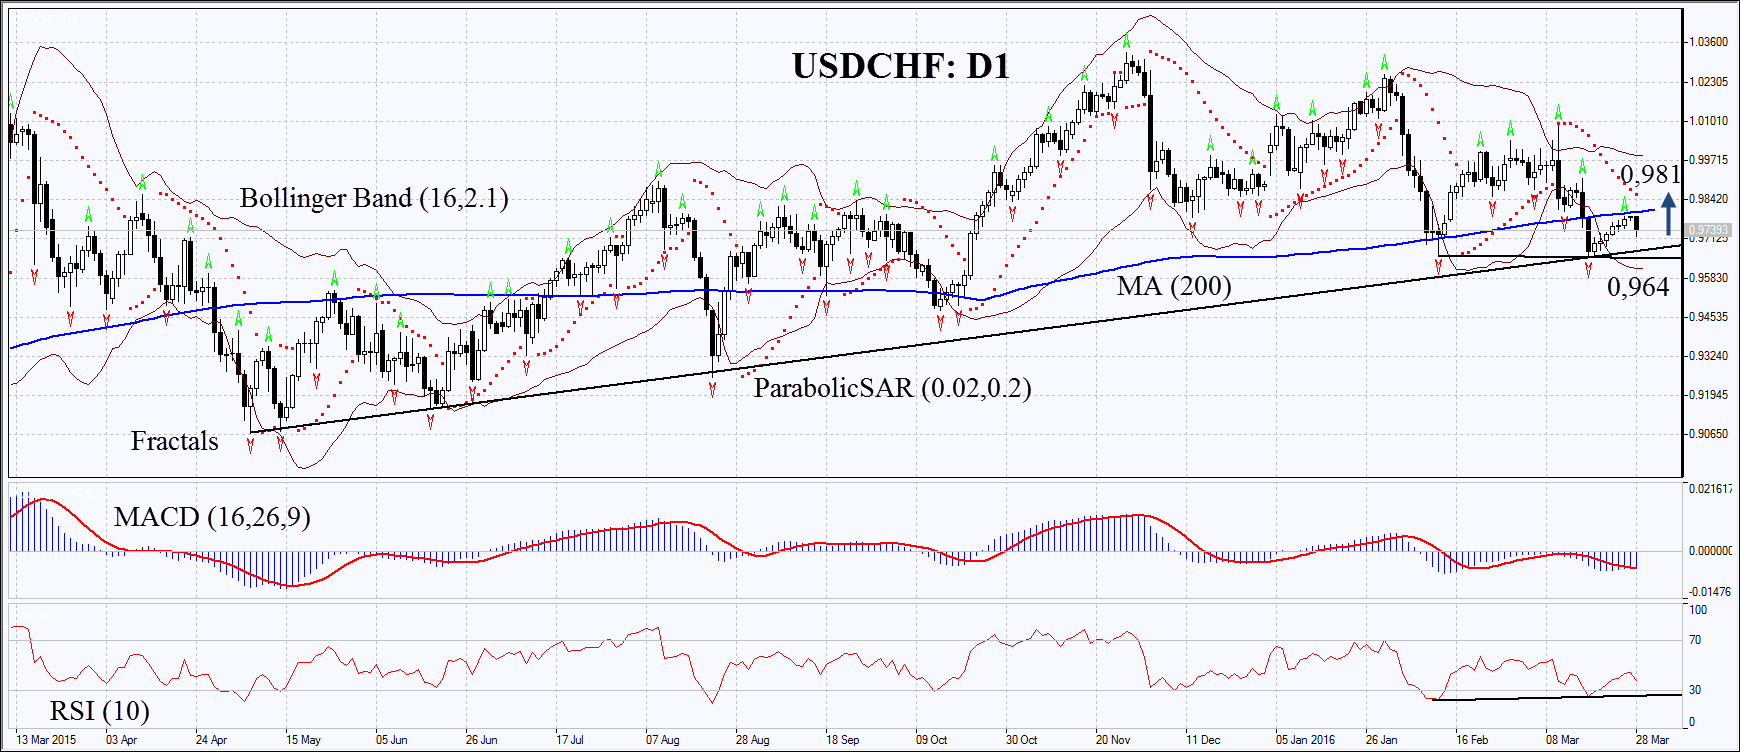
On the daily chart USDCHF: D1 is in long term rising trend. Two weeks ago it tested the support line, but failed to break down through it and slightly rebounded. MACD has formed the bullish signal while Parabolic has not reversed up yet. The RSI is below 50 having formed the positive divergence. The Bollinger bands have widened which means higher volatility. The bullish momentum may develop in case the Swiss franc surpasses the last fractal high and the 200-day moving average at 0,981. This level may serve the point of entry. The initial risk-limit may be placed below the last fractal low and the support of the uptrend at 0.964. Having opened the pending order we shall move the stop to the next fractal low following the Parabolic and Bollinger signals. Thus, we are changing the probable profit/loss ratio to the breakeven point. The most risk-averse traders may switch to the 4-hour chart after the trade and place there a stop-loss moving it in the direction of the trade. If the price meets the stop-loss level at 0.964 without reaching the order at 0.981, we recommend cancelling the position: the market sustains internal changes which were not taken into account.
| Position | Buy |
| Buy stop | above 0.981 |
| Stop loss | below 0.964 |
- Get Certificate

Note:
This overview has an informative and tutorial character and is published for free. All the data, included in the overview, are received from public sources, recognized as more or less reliable. Moreover, there is no guarantee that the indicated information is full and precise. Overviews are not updated. The whole information in each overview, including opinion, indicators, charts and anything else, is provided only for familiarization purposes and is not financial advice or а recommendation. The whole text and its any part, as well as the charts cannot be considered as an offer to make a deal with any asset. IFC Markets and its employees under any circumstances are not liable for any action taken by someone else during or after reading the overview.
