- Analytics
- Technical Analysis
USD JPY Technical Analysis - USD JPY Trading: 2015-06-01
Bearish divergence
Let us consider the USD/JPY currency pair on the H4 chart. The price has entered the consolidation zone, which may result in breaching the resistance level at 123.550. The consolidation is confirmed by the Donchian channel slope. However, we have already seen the indications of new trend shaping. It is assured by the H4 line breakout and by the ParabolicSAR turn to the red zone. Meanwhile, the bearish RSI-Bars divergence is considered the most important.
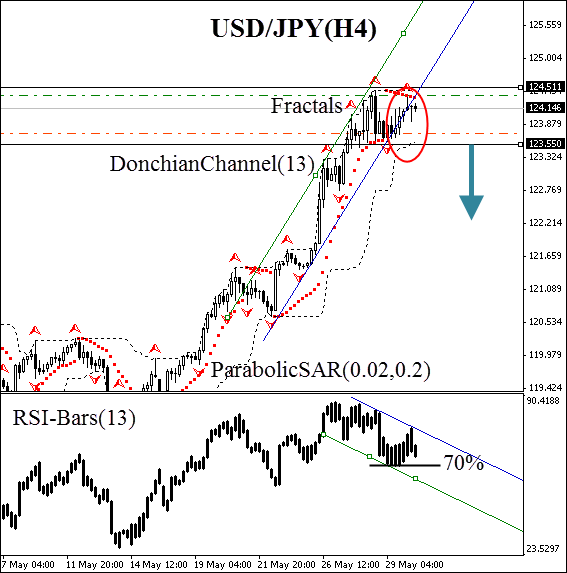
The downward momentum is expected to continue after crossing the fractal at 123.550. It is likely to generate a movement, which range is determined by the side trend height, i.e. 100 points. Conservative traders are recommended to pay attention to RSI-Bars oscillator. Its bars generally confirm the divergence. We advice to wait until the 70% mark is breached, confirming the bearish momentum. A stop loss is supposed to be placed at 124.511 resistance mark, which is supported by the Donchian channel upper boundary and the Bill Williams fractal. After pending order activation the stop loss is to be moved every four hours near the next fractal high, following Parabolic signals. Thus we are changing the probable profit/loss ratio to the breakeven point.
| Position | Sell |
| Sell stop | below 123.550 |
| Stop loss | above 124.511 |
- Get Certificate

Note:
This overview has an informative and tutorial character and is published for free. All the data, included in the overview, are received from public sources, recognized as more or less reliable. Moreover, there is no guarantee that the indicated information is full and precise. Overviews are not updated. The whole information in each overview, including opinion, indicators, charts and anything else, is provided only for familiarization purposes and is not financial advice or а recommendation. The whole text and its any part, as well as the charts cannot be considered as an offer to make a deal with any asset. IFC Markets and its employees under any circumstances are not liable for any action taken by someone else during or after reading the overview.
