- Analytics
- Technical Analysis
Wheat vs Canadian dollar Technical Analysis - Wheat vs Canadian dollar Trading: 2017-09-04
Crop reduction is expected in Canada and the UK
In this review, we suggest considering the personal composite instrument (PCI) "Wheat versus the Canadian dollar". It increases in case of the wheat price growth in the world market and the weakening of the Canadian dollar. Is there a possibility for the WHEAT/CAD quotes to increase?
The wheat prices rose for the first time after a six-week continuous decline. Besides the damage to a part of the US crops by Hurricane Harvey, this was triggered by the possible reduction of the wheat crop in Canada to the lowest level for the last 6 years. The state agency Statistics Canada announced that in 2017, 25.5 mln tonnes of grain will be harvested in the country. This is by 2.7% lower than the expectations of market participants (26.2 mln tonnes) and by 19.6% less than the last year level (31.7 mln tonnes). At the beginning of July 2017, the UK wheat reserves fell to 1.39 mln tonnes, which is by 38% lower than the last year level. The main reason for this was the wheat crop reduction in 2016 by 13% to 14.4 mln tonnes. In the current year, the UK grain production may show an additional reduction. The Canadian dollar has strengthened by 10% against the US dollar over the past 4 months and reached the highest level since June 2015. Theoretically, a technical correction may occur at some point.
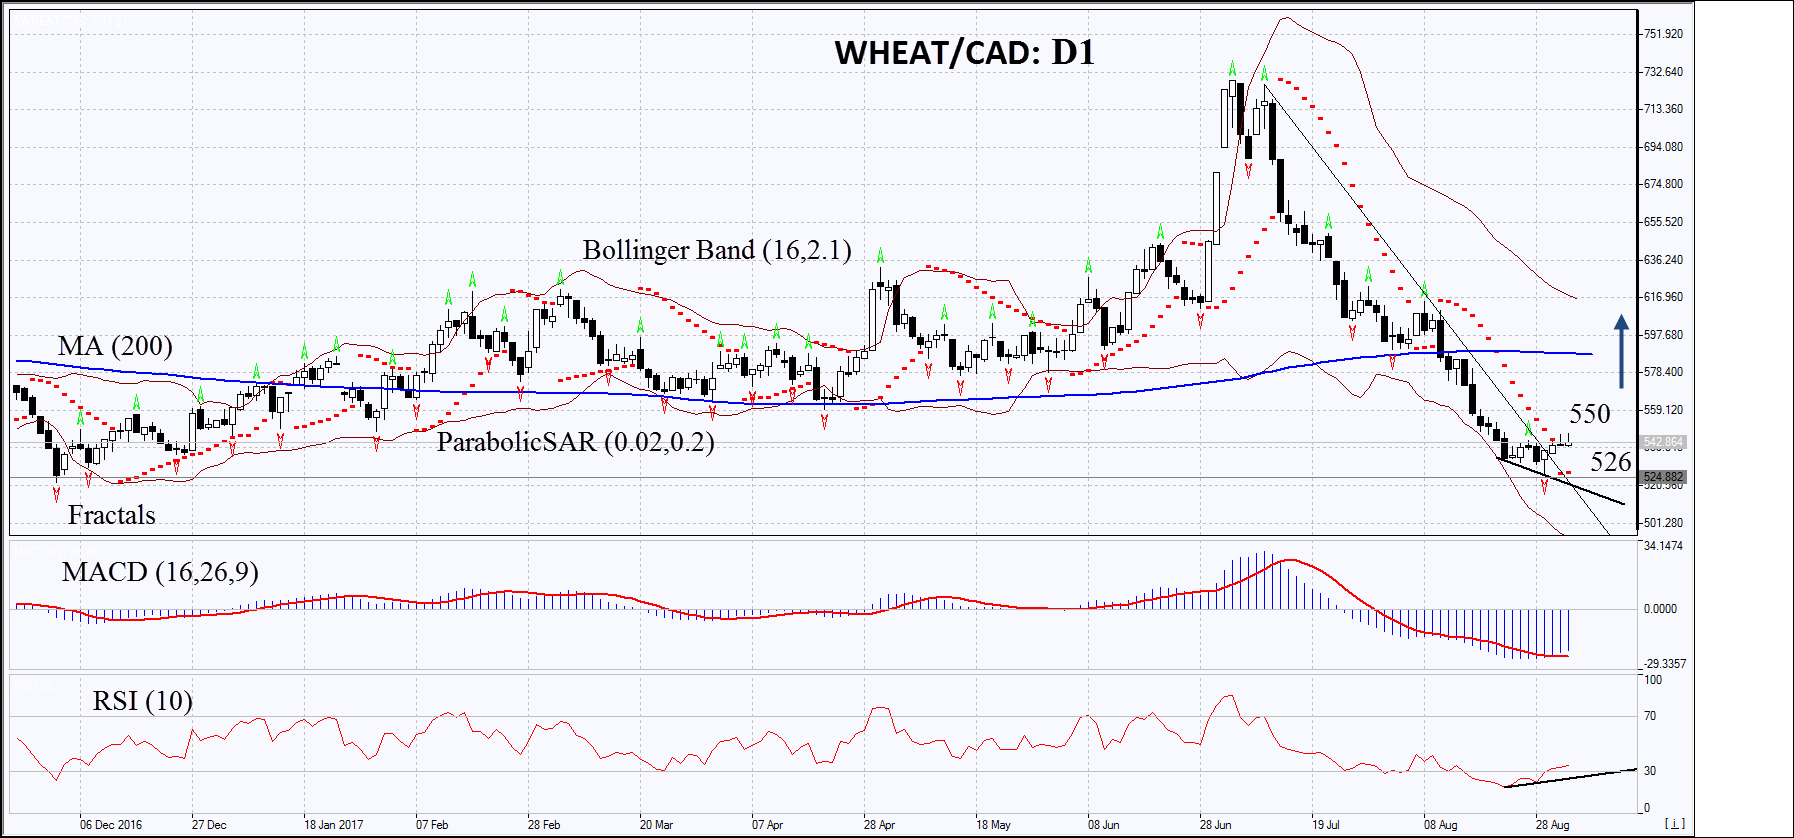
On the daily timeframe, WHEAT/CAD: D1 came out of the downtrend. The further price increase is possible in case of the worsening of the Canadian economic conditions and the decrease in the world wheat crop.
- The Parabolic indicator gives a bullish signal.
- The Bollinger bands have markedly widened, which means high volatility.
- The RSI indicator came out of the oversold zone and started to rise. It has formed a positive divergence.
- The MACD indicator gives a bullish signal.
The bullish momentum may develop in case WHEAT/CAD exceeds the level of 550. This level may serve as an entry point. The initial stop loss may be placed below the last fractal low, the 9-month low and the Parabolic signal at 526. After opening the pending order, we shall move the stop to the next fractal low following the Bollinger and Parabolic signals. Thus, we are changing the potential profit/loss to the breakeven point. More risk-averse traders may switch to the 4-hour chart after the trade and place there a stop loss moving it in the direction of the trade. If the price meets the stop level at 526 without reaching the order at 550 we recommend cancelling the position: the market sustains internal changes that were not taken into account.
Summary of technical analysis
| Position | Buy |
| Buy stop | Above 550 |
| Stop loss | Below 526 |
Explore our
Trading Conditions
- Spreads from 0.0 pip
- 30,000+ Trading Instruments
- Stop Out Level - Only 10%
Ready to Trade?
Open Account Note:
This overview has an informative and tutorial character and is published for free. All the data, included in the overview, are received from public sources, recognized as more or less reliable. Moreover, there is no guarantee that the indicated information is full and precise. Overviews are not updated. The whole information in each overview, including opinion, indicators, charts and anything else, is provided only for familiarization purposes and is not financial advice or а recommendation. The whole text and its any part, as well as the charts cannot be considered as an offer to make a deal with any asset. IFC Markets and its employees under any circumstances are not liable for any action taken by someone else during or after reading the overview.
