- Analytics
- Technical Analysis
WHEAT Technical Analysis - WHEAT Trading: 2016-09-20
Lower wheat crop quality supports wheat prices
World wheat crop quality is getting as a record world harvest is expected. Will the wheat price continue falling?
US Department of Agriculture reported on Friday this year's world wheat crop, though estimated to exceed last year’s record high by 10.m tonnes at 744.8m tonnes, is expected to be of much lower quality - lower in protein content. The decline in quality was attributed to higher yields - wheat yield is negatively correlated with quality, and damage from late-season rainfall. This is additional bullish news for wheat after EU wheat quality was last week. FranceAgriMer, the French farm office, forecast soft wheat crop at 28.47m tonnes as wet weather and insufficient sunshine resulted in the lowest yields in 33 years. Lower quality of world wheat crop is bullish for what.
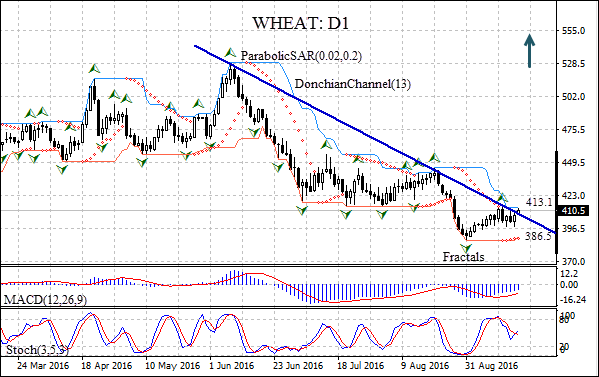
On the daily timeframe WHEAT: D1 has been declining after hitting ten month high in mid-June. The price has breached the resistance line after retracing from ten-year low.
- The Donchian channel gives a neutral signal: it is flat.
- The Parabolic indicator has formed a buy signal.
- MACD indicator is above the signal line and the signal line is edging up, which is also a bullish signal.
- The stochastic oscillator is rising and has not reached the overbought zone yet.
We expect the bullish momentum will continue after the price breaches and closes above the upper Donchian channel at 413.1, confirmed also by last fractal high. It can be used as an entry point for a pending order to buy. The stop loss can be placed below the last fractal low at 386.5. After placing the pending order the stop loss is to be moved following Parabolic signals. Thus, we are changing the profit/loss ratio to the breakeven point. If the price meets the stop loss level (386.5) without reaching the order (413.1), we recommend cancelling the position: the market sustains internal changes which were not taken into account.
Technical Analysis Summary
| Position | Buy |
| Buy stop | Above 413.1 |
| Stop loss | Below 386.5 |
- Get Certificate

Note:
This overview has an informative and tutorial character and is published for free. All the data, included in the overview, are received from public sources, recognized as more or less reliable. Moreover, there is no guarantee that the indicated information is full and precise. Overviews are not updated. The whole information in each overview, including opinion, indicators, charts and anything else, is provided only for familiarization purposes and is not financial advice or а recommendation. The whole text and its any part, as well as the charts cannot be considered as an offer to make a deal with any asset. IFC Markets and its employees under any circumstances are not liable for any action taken by someone else during or after reading the overview.
