- Analytics
- Technical Analysis
Silver Technical Analysis - Silver Trading: 2018-09-26
The demand for silver may increase
In this review, we will consider the trading instrument silver against the euro. Will the XAGEUR rise? The upward movement occurs when silver prices rise, and the euro weakens.
Approximately 15% of silver in the world is used for the production of coins and ingots for investment purposes, 26% in jewelry and 59% in the industry. Recently, the demand for this metal for industrial use has been increasing due to the active development of photovoltaics and the production of solar batteries, as well as in automotive electrical systems and electronics. According to the forecasts of the GFMS agency, in 2018, 82 GW of solar power plants will be built in the world, which will require 80 million ounces of silver. In 2017, sales of new passenger cars and light commercial vehicles in the world increased by 2.4%, and silver consumption in the automotive industry - by 5%. The increase in the production of electric vehicles contributed to the strong growth. In subsequent years, global solar energy and the automotive industry can continue to develop actively.
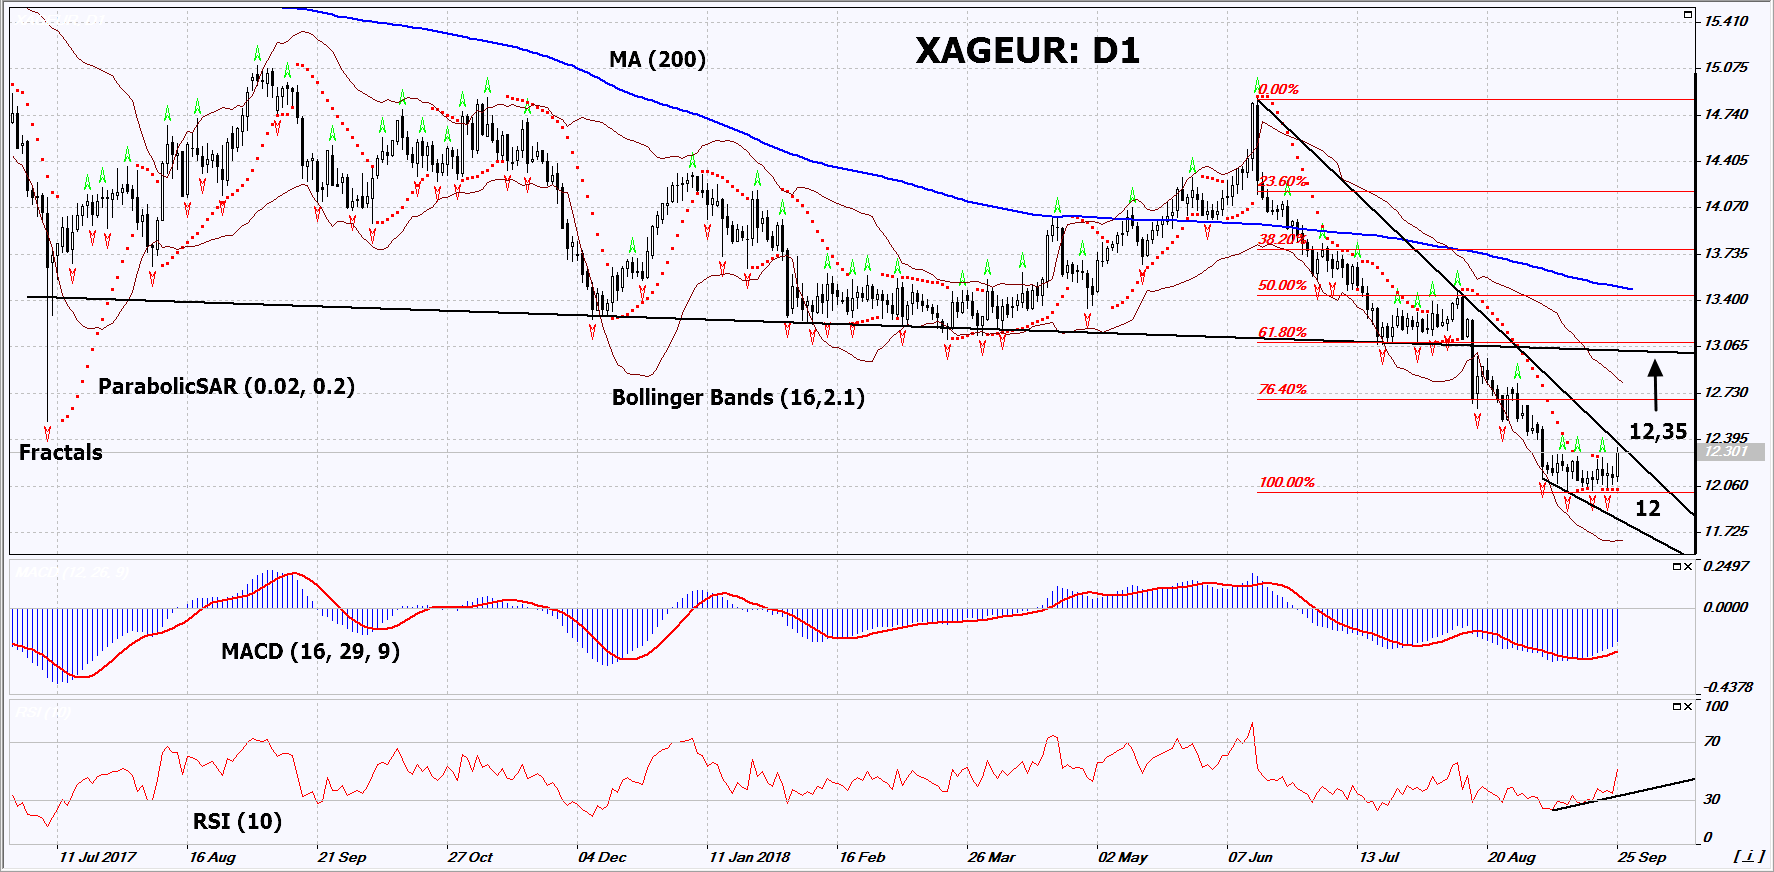
On the daily timeframe,XAGEUR: D1approached the resistance line of the falling channel. It should be overcome before opening a buy position. A number of technical analysis indicators formed buy signals. The further price growth is possible in case of an increase in the demand for silver and the weakening of the euro against the US dollar after the expected Fed rate hike at the next meeting on September 26.
- The Parabolic indicator gives a bullish signal.
- The Bollinger bands have widened, which indicates high volatility. The lower band is titled upward.
- The RSI indicator is above 50. It has formed a positive divergence.
- The MACD indicator gives a bullish signal.
The bullish momentum may develop in case XAGEUR exceeds the three last fractal highs and the the resistance line of the downtrend at 12.35. This level may serve as an entry point. The initial stop loss may be placed below the 4 last fractal lows, the low since February 2010 and the Parabolic signal at 12. After opening the pending order, we shall move the stop to the next fractal low following the Bollinger and Parabolic signals. Thus, we are changing the potential profit/loss to the breakeven point. More risk-averse traders may switch to the 4-hour chart after the trade and place there a stop loss moving it in the direction of the trade. If the price meets the stop level (12) without reaching the order (12.35), we recommend to close the position: the market sustains internal changes that were not taken into account.
Summary of technical analysis
| Position | Buy |
| Buy stop | Above 12.35 |
| Stop loss | Below 12 |
- Get Certificate

Note:
This overview has an informative and tutorial character and is published for free. All the data, included in the overview, are received from public sources, recognized as more or less reliable. Moreover, there is no guarantee that the indicated information is full and precise. Overviews are not updated. The whole information in each overview, including opinion, indicators, charts and anything else, is provided only for familiarization purposes and is not financial advice or а recommendation. The whole text and its any part, as well as the charts cannot be considered as an offer to make a deal with any asset. IFC Markets and its employees under any circumstances are not liable for any action taken by someone else during or after reading the overview.
