- Analytics
- Technical Analysis
Gold Technical Analysis - Gold Trading: 2015-04-28
Gold rises before tomorrow Fed meeting
Gold futures showed a sharp growth on Tuesday as the American dollar hit its eight-week low after publication of a negative April Consumer Confidence Index. It slumped to 95.2 from 101.4, registered in March, while analysts forecasted growth to 102.5. That made investors doubt Fed rate hike in the short term. We remind that today FRS begins the meeting and will hold a press conference tomorrow. It is obvious that nobody expects the rate to be raised right away, however, market participants expect it to happen in September. It is worth mentioning that gold price moved once again above “psychological” $1200 per ounce. Concerns over the default in Greece (the European Union hasn't granted financial aid yet) produced additional support to gold. Meanwhile, Greece requires 7.2 bln euro by the end of May to make the first debt payments. To be noted, gold quotes climb due to falling gold import to China via Hong Kong (the amount dropped to its seven-month lowest – 66.36 tons). According to GFMS experts, the global demand for gold in the first quarter contracted 9% because Chinese industry reduced gold consumption 12%. This factor certainly increases risks when opening a long position.
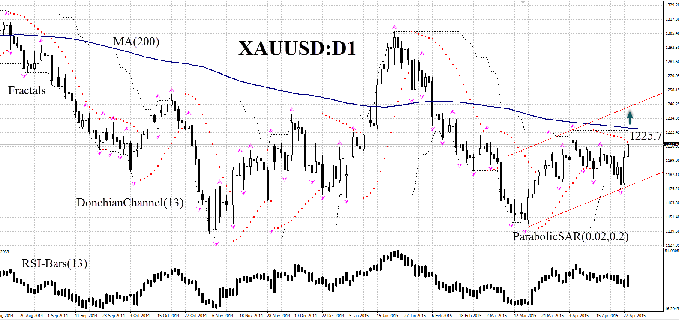
The XAU/USD pair on the daily chart is traded in a range below the Moving Average 200. Following two days of growth, the price has moved above the latest upper fractal, considered as a resistance level. Parabolic may shape a buy signal. At the moment we observe a pullback in prospect of American indicators. RSI-Bars latest signal breached 50, being far away from the overbought zone. We do not exclude the bullish momentum to continue, if the price breaches the fractal high, the Donchian Channel upper boundary and the MA 200 at 1225.7 – a buy pending order may be placed there. Stop loss may be placed near the Donchian Channel bottom and the local fractal low, which may now act as a support line – 1183. After pending order activation the stop loss is to be moved every 4 hours near the next fractal low, following Parabolic signals. Thus, we are changing the probable profit/loss ratio to the breakeven point. If the price meets the stop loss without reaching the order, we recommend cancelling the position: market sustains internal changes that were not considered.
| Position | Buy |
| Buy stop | above 1225,7 |
| Stop loss | below 1183 |
Dear traders. For the detailed report of the strategy, based on analytical issues of technical analysis, click here.
- Get Certificate

Note:
This overview has an informative and tutorial character and is published for free. All the data, included in the overview, are received from public sources, recognized as more or less reliable. Moreover, there is no guarantee that the indicated information is full and precise. Overviews are not updated. The whole information in each overview, including opinion, indicators, charts and anything else, is provided only for familiarization purposes and is not financial advice or а recommendation. The whole text and its any part, as well as the charts cannot be considered as an offer to make a deal with any asset. IFC Markets and its employees under any circumstances are not liable for any action taken by someone else during or after reading the overview.
